
 BEA is getting ready for its big summer update of GDP and other national economic statistics, coming in late July. This annual ritual of refining figures from the last three years can be confusing. People wonder: Were the old numbers wrong? Are these new figures final? No, and not really. The numbers change because calculating GDP – the most comprehensive measure of U.S. economic activity – is always a work in progress.
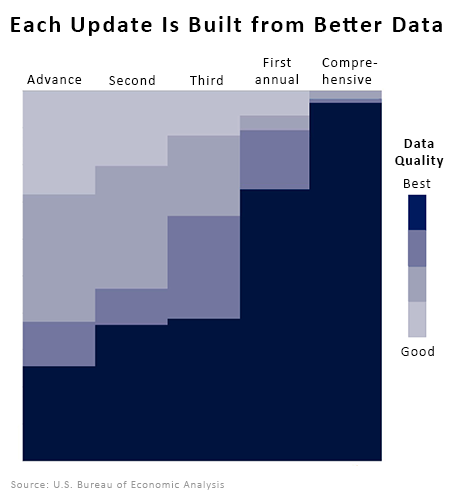
Thousands of data points from more than 300 public and private sources feed into estimates of U.S. gross domestic product. Some information flows in fairly quickly, some takes months to arrive. The preeminent data, from the nation’s economic census, comes only once every five years. Yet BEA’s economists make their first estimate of a quarter’s GDP only about a month after that quarter ends.
How do they do that? The economists who produce quarterly GDP estimates – about 100 people – work with the best data available and, where necessary, fill in the gaps with projections based on alternative data sources and, in some cases, historical trends. The resulting estimates of the rate of growth or decline in the nation’s GDP have proven to be reliable snapshots of economic change. That first look at each quarter is in high demand from policymakers, investors, business people, journalists and others who need to know what’s happening in the economy, fast.
But that’s only the beginning. Over the next two months, more economic information about that quarter will arrive from government surveys, private data collectors and other sources, and the initial GDP estimate will be updated two more times. Later, it will be recalculated as part of BEA’s annual update in the summer – adding more complete information about consumer spending, state and local government spending, investment in business equipment, and more. The summer updates affect quarterly and annual GDP statistics from at least the previous three years.
Even then, a GDP number is never really finished. About every five years, following release of the Census Bureau’s economic census, BEA does a comprehensive review that further refines GDP estimates and their component statistics. This is when major changes in definitions and methodologies are typically introduced, and they may result in updates to statistics dating as far back as 1929, the first year for which annual estimates are published.
Even as the numbers fluctuate over the months and years, the big picture of long-term growth and business cycles captured by the initial GDP estimates holds up well, BEA studies show.
Confused? It’s easier to keep track if you know the schedule. Here’s the cycle of estimates for U.S. quarterly GDP:
ADVANCE:
- About a month after a quarter ends
- A closely watched first look at the general economic picture
SECOND:
- About two months after the quarter ends
- Reflects more complete source data
- GDP rate may climb or fall 0.5 percentage point from advance estimate, on average
THIRD:
- About three months after the quarter ends
- More data means less reliance on projections
- GDP rate may climb or fall 0.2 percentage point from second estimate, on average
ANNUAL:
- Every summer
- Includes a substantial influx of comprehensive data, such as annual surveys or tax data
- Also may reflect improvements in methodology
- Updates annual and quarterly estimates for the previous three years (and sometimes more)
- Updates the first quarter of the current year, too
- Also called the “annual revision”
COMPREHENSIVE:
- Typically once every five years
- Includes the most comprehensive available data, including from the economic census
- Captures changes in the production environment in the U.S. economy
- Incorporates changes in how the U.S. economy is measured
- Reflects changes in international statistical standards
- Recalculates annual statistics, dating back to 1929 in some cases, to conform
- Recalculates quarterly statistics, sometimes back to 1947
- Also called the “comprehensive revision”
From the advance estimate to the most recent comprehensive update, the average amount of change for a real, or inflation-adjusted, GDP rate is plus or minus 1.2 percentage points.
BEA’s cycle of GDP updates reflects a dedication to timeliness, accuracy and completeness. The estimates are informative and reliable, but they may never be completely final – if there are improvements to data feeding into GDP or improvements to statistical standards.