
Real personal income across all regions rose by an average of 2.9 percent in 2014. This growth rate reflects the year-over-year change in nominal personal income across all regions adjusted by the change in the national personal consumption expenditures (PCE) price index. On a nominal basis, personal income across all regions grew an average of 4.4 percent in 2014. In 2014, the U.S. PCE price index grew 1.4 percent.
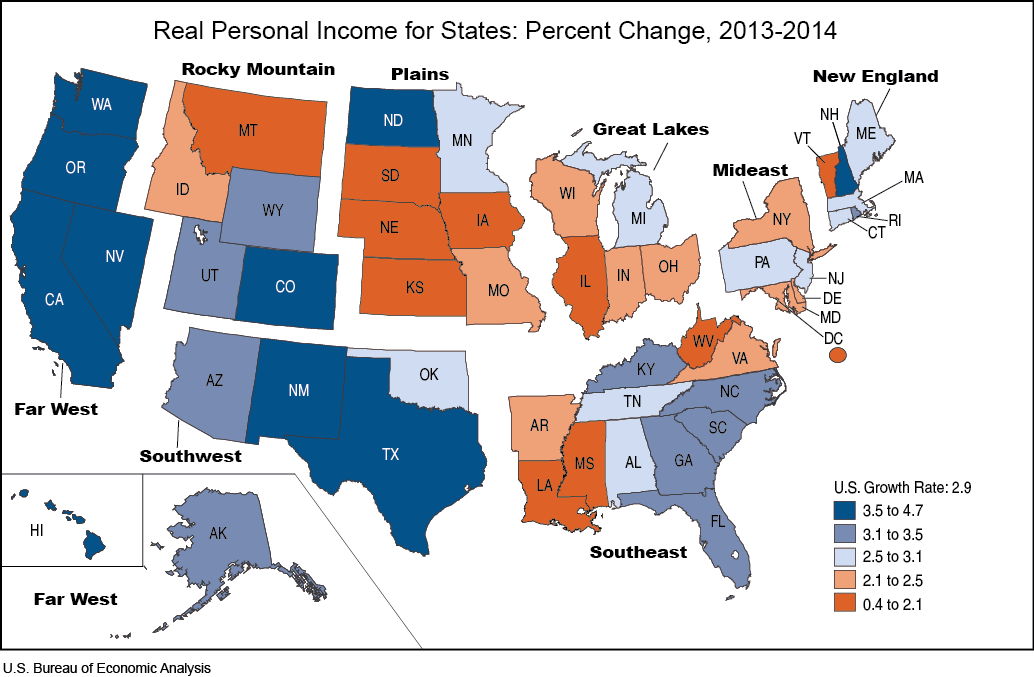
Growth in real state personal income in 2014 ranged from 4.7 percent in Nevada to 0.4 percent in South Dakota. These growth rates reflect the year-over-year change in the state’s nominal personal income, the change in the national PCE price index, and the change in the state’s regional price parity. After Nevada, the states with the highest growth rates were Colorado (4.5 percent), Texas (4.2 percent), Washington (4.0 percent), and Oregon (4.0 percent). After South Dakota, the states with the slowest rates of growth were Kansas (0.5 percent), West Virginia (0.7 percent), Illinois (1.0 percent), and Vermont (1.3 percent). States with growth rates close to the national average were Alaska (3.1 percent), Oklahoma (3.1 percent), Michigan (2.9 percent), New Jersey (2.9 percent), Massachusetts (2.8 percent), Connecticut (2.8 percent), and Tennessee (2.8 percent).
For more information, read the full report.