
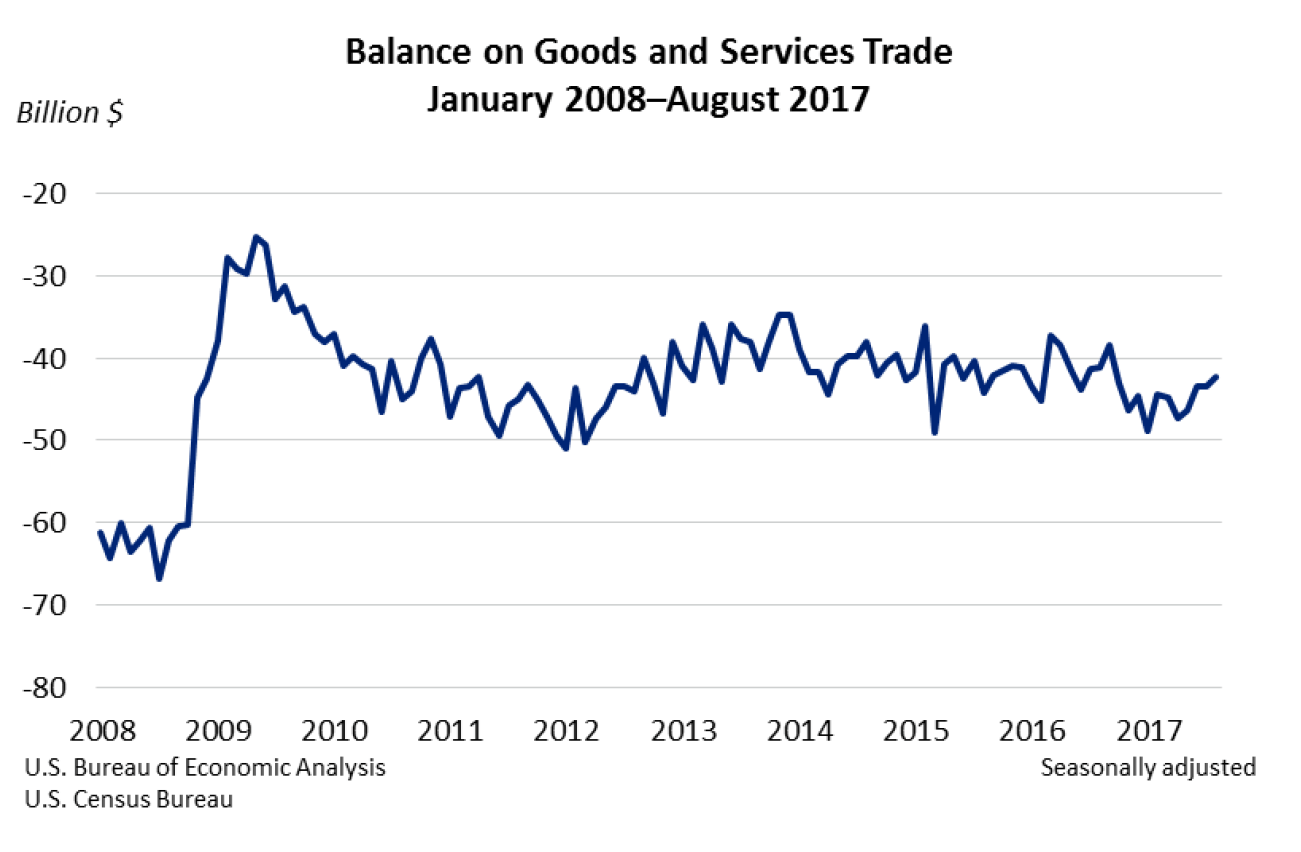
The U.S. monthly international trade deficit decreased in August 2017 according to the U.S. Bureau of Economic Analysis and the U.S. Census Bureau. The deficit decreased from $43.6 billion in July (revised) to $42.4 billion in August, as exports increased and imports decreased. The previously published July deficit was $43.7 billion. The goods deficit decreased $0.9 billion in August to $64.4 billion. The services surplus increased $0.3 billion in August to $22.0 billion.
Exports
Exports of goods and services increased $0.8 billion, or 0.4 percent, in August to $195.3 billion. Exports of goods increased $0.6 billion and exports of services increased $0.2 billion.
- The increase in exports of goods mostly reflected increases in consumer goods ($1.0 billion) and in capital goods ($0.4 billion). Decreases in industrial supplies and materials ($1.0 billion) and in food, feeds, and beverages ($0.4 billion) partly offset the increases.
- The increase in exports of services mostly reflected increases in travel (for all purposes including education) ($0.1 billion), in other business services ($0.1 billion), which includes research and development services; professional and management services; and technical, trade-related, and other services, and in financial services ($0.1 billion). A decrease in transport ($0.2 billion), which includes freight and port services and passenger fares, partly offset the increases.
Imports
Imports of goods and services decreased $0.4 billion, or 0.1 percent, in August to $237.7 billion. Imports of goods decreased $0.3 billion and imports of services decreased $0.1 billion.
- The decrease in imports of goods mostly reflected decreases in industrial supplies and materials ($0.5 billion) and in capital goods ($0.5 billion). An increase in automotive vehicles, parts, and engines ($0.7 billion) partly offset the decreases.
- The decrease in imports of services mostly reflected a decrease in transport ($0.2 billion). An increase in travel (for all purposes including education) ($0.1 billion) partly offset the decrease.
For more information, read the full report.