
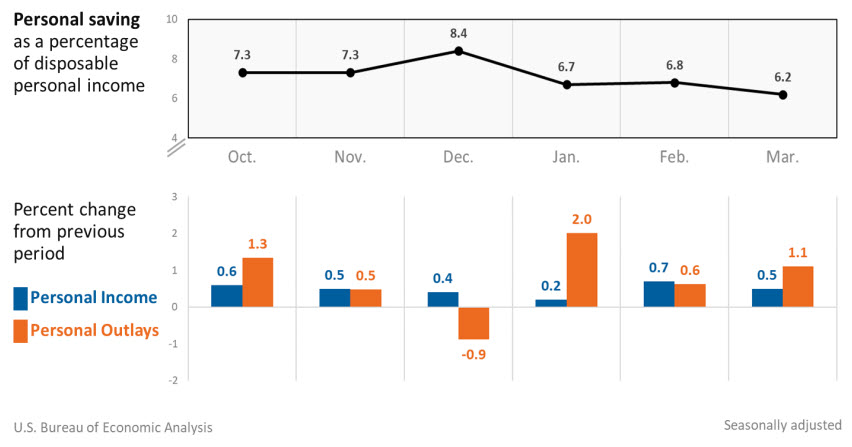
Personal income increased $107.2 billion, or 0.5 percent at a monthly rate, while consumer spending increased $185.0 billion, or 1.1 percent, in March. The increase in personal income primarily reflected an increase in compensation. The personal saving rate (that is, personal saving as a percentage of disposable personal income) was 6.2 percent in March, compared with 6.8 percent in February.
Personal income
In March, personal income increased, primarily reflecting increases in compensation, proprietors’ income, personal income receipts on assets, and government social benefits.
- Within compensation, the increase primarily reflected an increase in private wages and salaries, based on data from the Bureau of Labor Statistics (BLS) Current Employment Statistics. Wages and salaries of services-producing industries increased $48.8 billion, while wages and salaries of goods-producing industries increased $10.8 billion.
- Within proprietors’ income, farm proprietors’ income increased, primarily reflecting increased crop and livestock prices.
- Within income receipts on assets, interest income increased $9.1 billion while dividend income increased $2.6 billion.
- The increase in government social benefits primarily reflected increases in Medicare and Medicaid. Federal pandemic-related assistance programs continued to wind down. Additional information on special factors affecting monthly personal income can be found on Effects of Selected Federal Pandemic Response Program on Personal Income.
Consumer spending
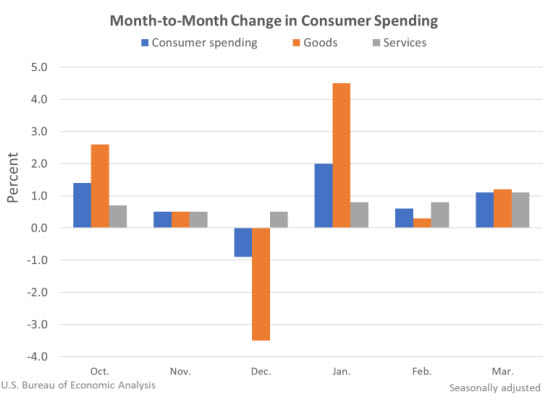
Personal outlays increased in March, reflecting an increase in consumer spending for services and goods.
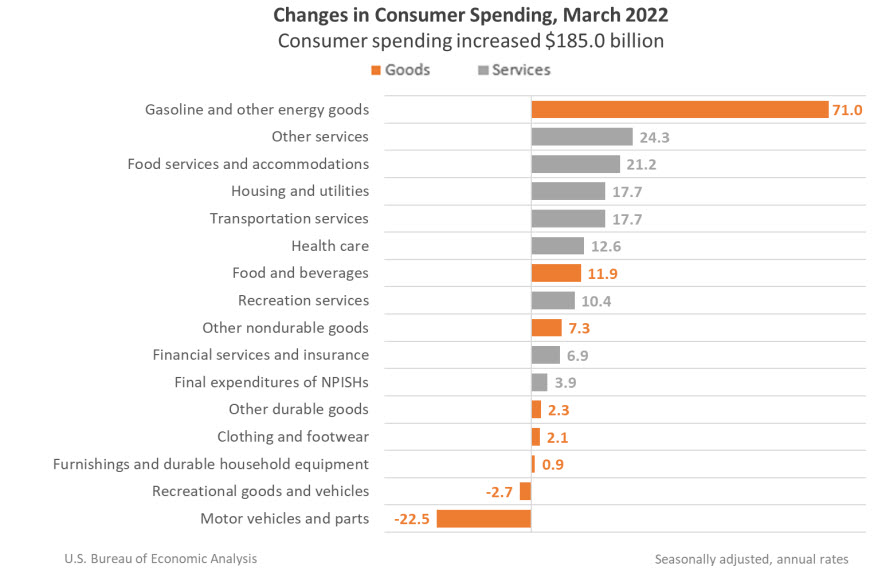
- Within services, the increase was widespread and led by “other” services (notably international travel), based on data from BEA’s International Transactions Accounts, as well as food services and accommodations, based on Census Bureau Monthly Retail Trade Survey (MRTS) data.
- Within goods, the increase primarily reflected gasoline and other energy goods, based on data from the Energy Information Administration, as well as food and beverages, based on MRTS data. These increases were partly offset by a decrease in motor vehicles and parts (led by new motor vehicles, specifically, light trucks), based on unit sales data from Wards Intelligence.
Spending on food services as well as most categories of goods reflect updated Census retail sales data that were recently benchmarked to results from the most recent annual survey.
PCE price index
The personal consumption expenditures (PCE) price index for March increased 6.6 percent from one year ago, reflecting increases in both goods and services. Energy prices increased 33.9 percent while food prices increased 9.2 percent. Excluding food and energy, the PCE price index for March increased 5.2 percent from one year ago.
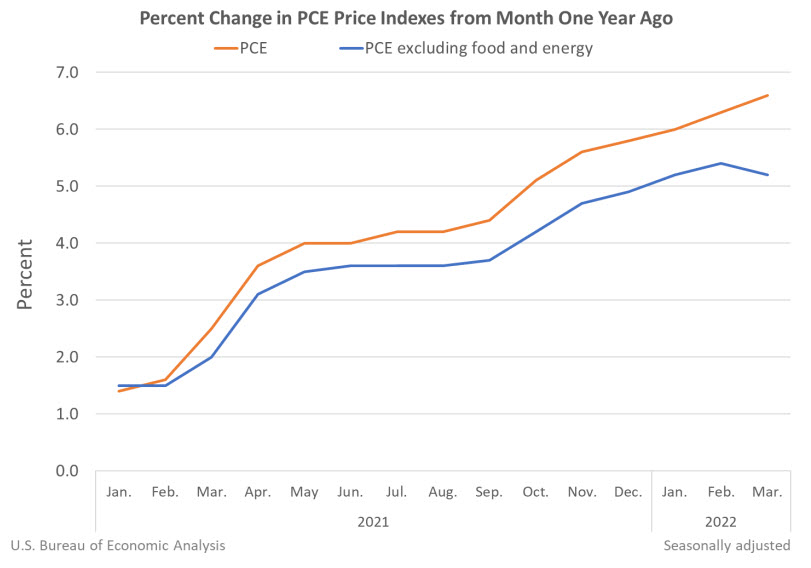
Compared to February, the PCE price index increased 0.9 percent, reflecting increases in both goods and services. Energy prices increased 11.8 percent while food prices increased 1.4 percent. Excluding food and energy, the PCE price index increased 0.3 percent from February to March.
For a comparison of PCE prices to BLS consumer price indexes, refer to NIPA Table 9.1U. Reconciliation of Percent Change in the CPI with Percent Change in the PCE Price Index.
For more information, read the full report.