
News Release
Gross Domestic Product by Metropolitan Area, 2006, and Revised 2004-2005
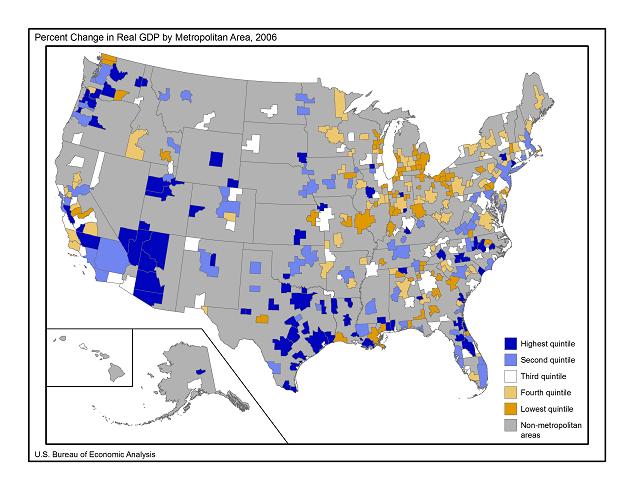
METROPOLITAN ECONOMIC GROWTH WIDESPREAD IN 2006
Newly available statistics released today by the U.S. Bureau of Economic Analysis show that real GDP by metropolitan area grew in 308 of 363 metropolitan (statistical) areas in 2006. Growth in the metropolitan portion of the United States was 3.2 percent in 2006, slightly greater than the 3.1 percent growth in 2005.1 Strong growth in financial industries—specifically real estate and securities, commodity contracts, and investments—accounted for 39 percent of U.S. metropolitan area GDP growth in 2006. Contraction in the construction industry tempered growth in most metropolitan areas.
- Current-dollar GDP for U.S. metropolitan areas was $11.8 trillion; accounting for 90% of the nation's $13.1 trillion GDP.
- GDP for the New York metropolitan area was $1.1 trillion which ranked it 1st among metropolitan areas; 2nd (behind California) when ranked among states and 10th (behind Spain) when ranked among countries.2
- The five largest metropolitan areas accounted for 23 percent of U.S. GDP.
- The smallest 78 metropolitan areas accounted for less than 2 percent of U.S. GDP.
Growth, measured in percent change, tends to be larger for small metropolitan areas than larger ones; therefore, it is useful to examine relative growth for similarly sized metropolitan areas. Phoenix-Mesa-Scottsdale, AZ (7.6 percent) was the fastest-growing metropolitan area among those with real GDP of more than $100 billion, while Lafayette, LA (15.6 percent) grew faster than other economies with real GDP between $10-100 billion. Among the smaller economies—those with real GDP of less than $10 billion—Houma-Bayou Cane-Thibodaux, LA (18.6 percent) grew the fastest in 2006, due in part to recovery from Hurricanes Katrina and Rita.
Relative to the nation, real growth was strong for metropolitan areas in the Southwest and in the Far West. In the Southwest, computer and electronic product manufacturing contributed the most to growth in the region. Austin-Round Rock, TX; Dallas-Fort Worth-Arlington, TX; Phoenix-Mesa-Scottsdale, AZ; and Houston-Sugar Land-Baytown, TX experienced double-digit growth in computer and electronic product manufacturing in 2006. In the Far West, Portland-Vancouver-Beaverton, OR-WA and Corvallis, OR also experienced strong growth in this industry.
In contrast, the economies of 55 metropolitan areas contracted in 2006; 27 of those metropolitan areas are in the Great Lakes region. A decline in manufacturing or construction typically subtracted from growth in these areas. The largest decline in real GDP by metropolitan area was in Detroit-Warren-Livonia, MI which contracted $4.3 billion (-2.3 percent) from 2005, largely due to declines in professional and business services, construction, and durable goods manufacturing.
Regional Industry Growth in 2006The real estate industry was the driving force behind growth in many metropolitan areas in 2006. In metropolitan areas where growth accelerated, however, contributions from the banking industry were more important to economic growth.
The banking industry contributed the most to real GDP growth in 41 metropolitan areas, most notably Charlotte-Gastonia-Concord, NC-SC and several metropolitan areas in South Dakota. In 25 of these 41 metropolitan areas, growth accelerated in 2006 from 2005.
The real estate industry contributed the most to real GDP growth in 53 metropolitan areas, but only 16 metropolitan areas experienced accelerated growth rates. While these 53 metropolitan areas are located throughout the United States, none are located in the New England region.
Per Capita Real GDPBridgeport-Stamford-Norwalk, CT had the highest per capita real GDP in 2006 ($78,944), which was 90 percent above the U.S. metropolitan area average. Bridgeport's ranking reflects its high concentration in the finance and insurance sector. McAllen-Edinburg-Mission, TX had the lowest per capita real GDP in 2006 ($14,900), which was 64 percent below the U.S. metropolitan area average.
RevisionsOverall, revisions were modest. Revisions to current-dollar GDP by metropolitan area in 2004 and 2005 were less than five percent (in absolute terms) for most metropolitan areas. The exceptions were: Palm Coast, FL (2004 and 2005); Lake Charles, LA; Casper, WY; Lawrence, KS (2004 and 2005); Cleveland, TN; Iowa City, IA; and Pascagoula, MS. Revisions to the real estate industry led to sizable revisions in Palm Coast, FL; Cleveland, TN; and Iowa City, IA, while revisions to petroleum and coal product manufacturing led to sizable revisions in Lake Charles, LA and Pascagoula, MS.
The GDP-by-metropolitan-area statistics for 2004-2006 incorporate new and revised source data from BEA's GDP-by-state statistics released June 5, 2008; state personal income statistics released March 26, 2008; and local area personal income statistics released April 24, 2008.
Tables 1-4 show these results in more detail; complete detail is available on BEA's Web site at www.bea.gov.
Potential Uses of GDP by Metropolitan AreaThese statistics have many potential important uses, including determining the overall size and growth of metropolitan economies, analyzing comparative industrial growth across metropolitan America, and assessing the impacts of natural disasters on cities. For a list of other potential uses, see "Potential Uses of BEA's Statistics of GDP by Metropolitan Area."
Methodology for GDP by Metropolitan AreaThe methodology developed for these GDP-by-metropolitan-area statistics is not complicated and allows for the production of timely statistics that provide insight into the range of variation in level and growth in the production of goods and services among metropolitan areas. In addition, these statistics can be used to prepare comparative analytics among metropolitan areas with different industrial compositions.
The methodology relies heavily on state- and county-level industry earnings data to distribute GDP by state to metropolitan areas. Earnings represent 64 percent of GDP and provide a reasonable indicator of economic output for most regions. County-level earnings data are available on a relatively timely basis, thus facilitating the production of timely GDP-by-metropolitan-area estimates (counties are summed to their metropolitan areas and controlled to state-level GDP). While relatively simple, the methodology appears to produce very useful and reliable information on the level and growth of economic activity in metropolitan areas.
GDP is BEA's most comprehensive measure of economic activity, thus requiring the compilation of many sources of data, including earnings by industry. BEA is exploring methodological improvements to accelerate the compilation and estimation processes of GDP source data that will improve the timeliness of metropolitan area GDP statistics.
Comments on the Prototype EstimatesBEA received many comments from data users related to the prototype release of GDP by metropolitan area in September 2007. These comments included requests for: (1) more timely release of the statistics, (2) a reduction in the number of data suppressions, and (3) data for metropolitan divisions and counties (even at the sacrifice of industry detail). These requests and other recommendations are being considered as we explore ways to improve our statistics subject to available resources.
BEA is Interested in Your CommentsBEA is interested in your comments on the GDP-by-metropolitan-area statistics. There has been substantial interest in these statistics and BEA plans to continue to produce an annual series. Please send your comments or suggestions to gdpbymetro@bea.gov.
Explanatory Notes
DefinitionsGDP by metropolitan area is the sub-state counterpart of the nation's GDP, the Bureau's featured and most comprehensive measure of U.S. economic activity. GDP by metropolitan area is derived as the sum of the GDP originating in all the industries in the metropolitan area. Real GDP by metropolitan area is an inflation-adjusted measure based on national prices for the goods and services produced within that metropolitan area. The statistics of real GDP by metropolitan area and of quantity indexes with a base year of 2001 were derived by applying national implicit price deflators to the current-dollar GDP-by-metropolitan-area statistics for the 61 detailed NAICS-based industries.3 Then, the chain-type index formula that is used in the national accounts is used to calculate the statistics of total real GDP by metropolitan area and of real GDP by metropolitan area at more aggregated industry levels.
The U.S. metropolitan area growth rates of real GDP released today may differ from national real GDP growth rates released in July 2008 and the U.S. growth rates of real GDP by state released in June 2008. U.S. metropolitan area real GDP growth may differ from U.S. GDP by state growth due to the exclusion of non-metropolitan areas. Differences with the national growth in real GDP are primarily due to the direct linkage and consistency of GDP by metropolitan area statistics with the most recently released statistics of GDP by state and GDP by industry. At this point in time, GDP-by-state and GDP-by-industry statistics are based upon national real GDP statistics released in July 2007 and have not yet incorporated revisions to national GDP released in July 2008.
Metropolitan (statistical) areasThe metropolitan (statistical) areas used by BEA for its entire series of GDP statistics are the county-based definitions developed by the Office of Management and Budget (OMB) for federal statistical purposes and last updated in November 2007. OMB's general concept of a metropolitan area is that of a geographic area consisting of a large population nucleus together with adjacent communities having a high degree of economic and social integration with the nucleus.
The statistics of GDP by metropolitan area in current and real (chained) dollars are available from the Regional Economic Accounts page of the BEA Web site at /regional/index.htm.
Next release of GDP by metropolitan area - September 2009.
BEA's national, international, regional, and industry estimates; the Survey of Current Business; and BEA news releases are available without charge on BEA's Web site at www.bea.gov. By visiting the site, you can also subscribe to receive free e-mail summaries of BEA releases and announcements.
Footnotes
1. The growth rates may differ from the national rates of GDP growth. See the "Explanatory Notes" for a detailed description.
2. World Development Indicators database, World Bank, August 22, 2008.
3. County earnings are not available in 2000 on a NAICS basis. Therefore, the implicit price deflators and quantity indexes were re-based to 2001 in order to compute real GDP by metropolitan area.