News Release
GDP for American Samoa, the Commonwealth of the Northern Mariana Islands, Guam, and the U.S. Virgin Islands
WASHINGTON, D.C. (May 5, 2010) -- The Bureau of Economic Analysis (BEA) released its first set of estimates of gross domestic product (GDP) for American Samoa, the Commonwealth of the Northern Mariana Islands (CNMI), Guam, and the U.S. Virgin Islands (USVI).1
Objectively gauging changes in economic activity is difficult in the absence of comprehensive economic metrics, such as GDP. Until now, a framework did not exist to estimate the GDP of these four U.S. territories. The Statistical Improvement Program, funded by the Office of Insular Affairs (OIA) of the U.S. Department of the Interior, has made it possible for BEA to develop formal methodologies for measuring the GDP of the territories.
The estimates released today for the four territories cover the period 2002 to 2007. The estimates show that real GDP -- GDP adjusted to remove price changes -- grew over this period in each of the territories except the CNMI. From 2002 to 2007, American Samoa’s GDP grew at an average annual rate of 0.4 percent, Guam’s GDP grew at an average annual rate of 1.8 percent, and the USVI’s GDP grew at an average annual rate of 2.9 percent; in contrast, the CNMI’s GDP decreased at an average annual rate of 4.2 percent. (For comparison, the average annual growth rate for the United States (excluding the territories) was 2.8 percent over this period.) More detailed information for each territory is presented on the following pages.
In constructing the estimates for the territories, BEA used methodologies consistent with the methods used to estimate U.S. GDP. Information from the Economic Census of Island Areas was used to establish levels of GDP for each territory for the years 2002 and 2007. Annual series were then developed and used to estimate GDP for the intervening years. Because the territories are not included in most of the major surveys used by BEA to estimate U.S. GDP, the support of government leaders in the territories and the assistance provided by the territorial statistical offices were critical to the successful production of these estimates.
1 These estimates are based on limited source data and are subject to revision.
In May, June, and July, BEA will be releasing additional detail on the major components of GDP at press events in each of the territories. Moving forward, the agreement between OIA and BEA will extend and improve the estimates of GDP. BEA currently plans to release estimates for both 2008 and 2009 in the spring of 2011.
American Samoa
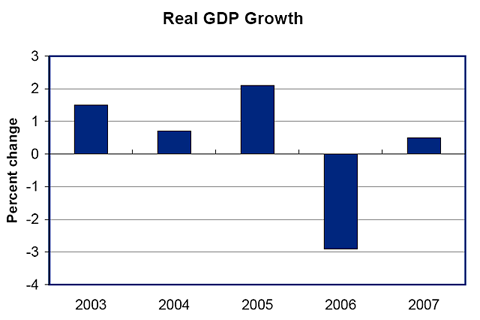
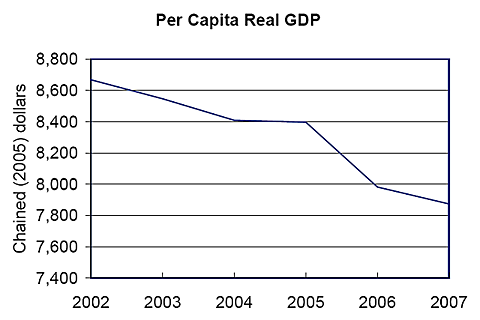
From 2002 to 2007, real GDP of American Samoa increased at an average annual rate of 0.4 percent. The annual growth rates of real GDP ranged from -2.9 percent to +2.1 percent. The volatility in the growth rates of real GDP was primarily accounted for by changes in the exports of canned tuna. The tuna canning industry was the largest private employer in American Samoa during this period.
| Summary Statistics for American Samoa | |||||||
| 2002 | 2003 | 2004 | 2005 | 2006 | 2007 | 2002-2007 AAGR1 | |
| GDP (millions of dollars) | 536 | 527 | 553 | 550 | 548 | 532 | -0.1% |
| Real GDP (millions of chained 2005 dollars) | 527 | 535 | 539 | 550 | 534 | 537 | 0.4% |
| Population2 | 60,800 | 62,600 | 64,100 | 65,500 | 66,900 | 68,200 | 2.3% |
| Real GDP per capita (chained 2005 dollars) | 8,668 | 8,546 | 8,409 | 8,397 | 7,982 | 7,874 | -1.9% |
| 1. Average annual growth rate. 2. Source: 2008 American Samoa Statistical Yearbook. |
From 2002 to 2007, the population of American Samoa increased at an average annual rate of 2.3 percent, and real GDP per capita decreased at an average annual rate of 1.9 percent.
Commonwealth of the Northern Mariana Islands (CNMI)
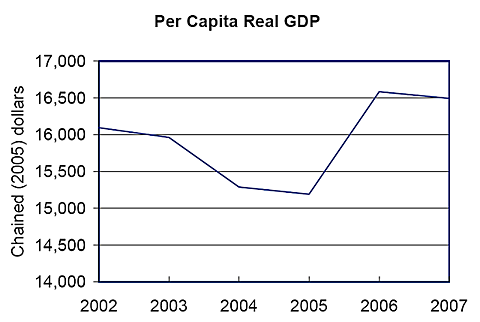
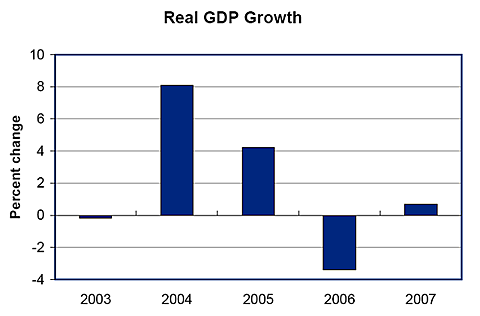
From 2002 to 2007, real GDP of the CNMI decreased at an average annual rate of 4.2 percent. The decrease in real GDP was primarily accounted for by a decrease in the exports of garments (reflecting a contraction in the garment manufacturing industry) and a decline in tourism. In 2005, the garment industry was impacted by reduced quotas on the imports of foreign textiles and garments. Since 2002, a number of economic shocks have contributed to a decline in tourism, including the SARS epidemic and the suspension of flights from Tokyo by Japan Airlines.
| Summary Statistics for the CNMI | |||||||
| 2002 | 2003 | 2004 | 2005 | 2006 | 2007 | 2002-2007 AAGR1 | |
| GDP (millions of dollars) | 1,320 | 1,267 | 1,229 | 1,073 | 1,007 | 962 | -6.1% |
| Real GDP (millions of chained 2005 dollars) | 1,197 | 1,223 | 1,206 | 1,073 | 1,006 | 967 | -4.2% |
| Population2 | 74,372 | 76,617 | 78,889 | 70,636 | 60,662 | 58,629 | -4.6% |
| Real GDP per capita (chained 2005 dollars) | 16,095 | 15,963 | 15,287 | 15,191 | 16,584 | 16,494 | 0.5% |
| 1. Average annual growth rate. 2. Source: U.S. Census Bureau, International Database. |
From 2002 to 2007, the population of the CNMI decreased rapidly as foreign workers left the territory, and as a consequence, real GDP per capita increased at an average annual rate of 0.5 percent.
Guam
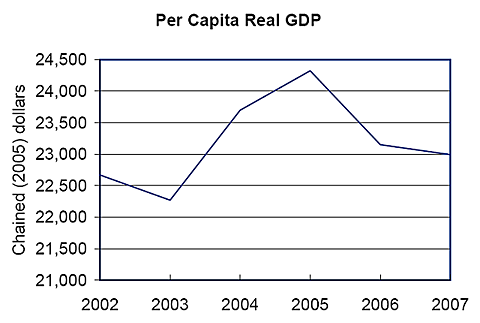
From 2002 to 2007, real GDP of Guam grew at an average annual rate of 1.8 percent. Year-to-year fluctuations in economic growth reflected changes in construction activity and in tourism. Guam's economy was significantly affected by a number of economic shocks over this period, including Typhoon Pongsona, the SARS epidemic, the outbreak of avian flu, and the financial downturn in Asia.
| Summary Statistics for Guam | |||||||
| 2002 | 2003 | 2004 | 2005 | 2006 | 2007 | 2002-2007 AAGR1 | |
| GDP (millions of dollars) | 3,568 | 3,542 | 3,846 | 4,100 | 4,176 | 4,280 | 3.7% |
| Real GDP (millions of chained 2005 dollars) | 3,651 | 3,643 | 3,936 | 4,100 | 3,959 | 3,988 | 1.8% |
| Population2 | 161,057 | 163,593 | 166,090 | 168,564 | 171,019 | 173,456 | 1.5% |
| Real GDP per capita (chained 2005 dollars) | 22,669 | 22,269 | 23,698 | 24,323 | 23,149 | 22,991 | 0.3% |
| 1. Average annual growth rate. 2. Source: 2008 Guam Statistical Yearbook. |
From 2002 to 2007, the population of Guam increased at an average annual rate of 1.5 percent, and real GDP per capita increased at an average annual rate of 0.3 percent.
U.S. Virgin Islands (USVI)
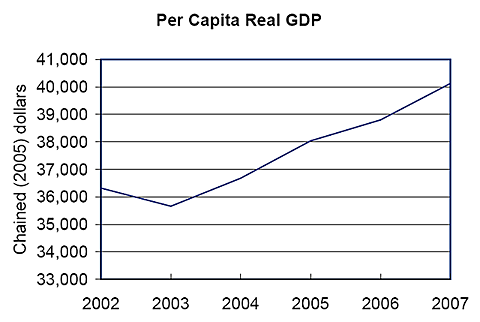
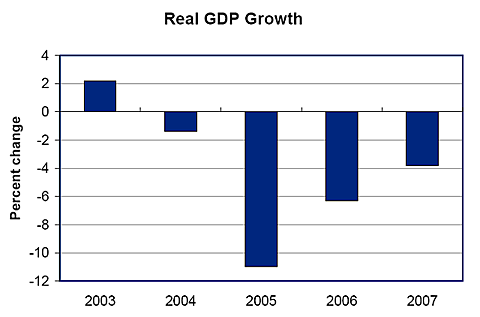
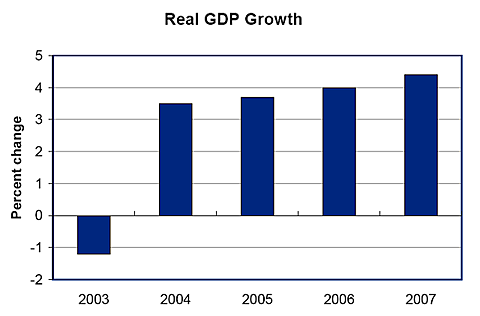
From 2002 to 2007, real GDP of the USVI grew at an average annual rate of 2.9 percent. Real GDP decreased in 2003, and then grew at increasing rates from 2004 to 2007. The major factors underlying the strong economic growth were the oil refining industry, tourism, and territorial government spending. The Hovensa oil refinery, located on St. Croix, is one of the world’s largest oil refineries.
| Summary Statistics for the USVI | |||||||
| 2002 | 2003 | 2004 | 2005 | 2006 | 2007 | 2002-2007 AAGR1 | |
| GDP (millions of dollars) | 3,085 | 3,248 | 3,605 | 4,240 | 4,298 | 4,580 | 8.2% |
| Real GDP (millions of chained 2005 dollars) | 3,996 | 3,949 | 4,088 | 4,240 | 4,411 | 4,604 | 2.9% |
| Population2 | 110,026 | 110,740 | 111,459 | 111,470 | 113,689 | 114,743 | 0.8% |
| Real GDP per capita (chained 2005 dollars) | 36,319 | 35,660 | 36,677 | 38,037 | 38,799 | 40,124 | 2.0% |
| 1. Average annual growth rate. 2. Source: 2008 U.S. Virgin Islands Annual Economic Indicators. |
From 2002 to 2007, the population of the USVI increased at an average annual rate of 0.8 percent, and real GDP per capita increased at an average annual rate of 2.0 percent.