
News Release
Gross Domestic Product for the U.S. Virgin Islands
CHARLOTTE AMALIE, U.S. VIRGIN ISLANDS (July 6, 2010) Today, the Bureau of Economic Analysis (BEA) is releasing its first set of estimates of the major components of gross domestic product (GDP) for the U.S. Virgin Islands.1
Objectively gauging changes in economic activity is difficult in the absence of comprehensive economic metrics, such as the GDP. Until now, a framework did not exist to estimate the GDP of the U.S. Virgin Islands. The Statistical Improvement Program, funded by the Office of Insular Affairs (OIA) of the U.S. Department of the Interior, has made it possible for BEA to develop formal methodologies for measuring the GDP of the U.S. Virgin Islands.
On May 5, 2010, BEA released estimates of total GDP for American Samoa, the Commonwealth of the Northern Mariana Islands, Guam, and the U.S. Virgin Islands. The estimates for the U.S. Virgin Islands showed that from 2002 to 2007, real GDP -- GDP adjusted to remove price changes -- grew at an average annual rate of 2.9 percent.2 (For comparison, the average annual growth rate for the United States (excluding the territories) was 2.8 percent over this period.)
The estimates released today supplement the estimates of total GDP for the U.S. Virgin Islands that were released in May. The accompanying tables present estimates for the major components of GDP, including consumer spending, private fixed investment, private inventory investment, net exports, and government spending.3 Also included in this release are estimates of the major components of gross domestic income.
The estimates of the major components of GDP highlight the impact that the oil refining industry had on the U.S. Virgin Islands economic growth over the period 2002 to 2007. Changes in exports, imports, and investment (including inventory investment) associated with the oil refining industry accounted for much of the year-to-year variation in real GDP growth over this period. Other notable factors were changes in territorial government spending and in consumer spending.
1 These estimates are based on limited source data and are subject to revision.
2 Summary GDP statistics for the U.S. Virgin Islands are presented on page 3 of this news release.
3 Consumer spending refers to personal consumption expenditures, inventory investment refers to change in private inventories, and government spending refers to government consumption expenditures and gross investment.
In constructing the estimates for the U.S. Virgin Islands, BEA used methodologies consistent with the methods used to estimate U.S. GDP. Information from the Economic Census of Island Areas was used to establish levels of GDP for the years 2002 and 2007. Annual series were then developed and used to estimate GDP for the intervening years. Because the U.S. Virgin Islands is not included in most of the major surveys used by BEA to estimate U.S. GDP, the support of government leaders in the U.S. Virgin Islands and the assistance provided by the Bureau of Economic Research, the Virgin Islands Bureau of Internal Revenue, and the Virgin Islands Department of Labor were critical to the successful production of the estimates presented in this release.
Moving forward, the agreement between OIA and BEA will extend and improve the estimates of GDP for the U.S. Virgin Islands. BEA currently plans to release estimates for both 2008 and 2009 in the spring of 2011.
U.S. Virgin Islands (USVI)
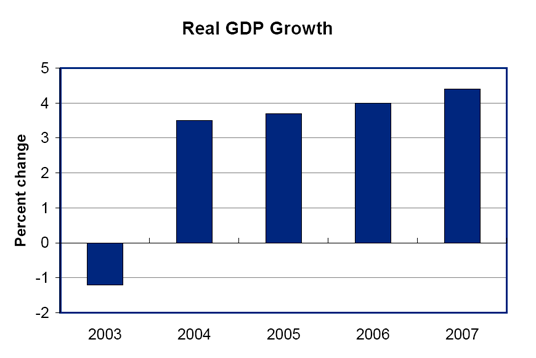
From 2002 to 2007, real GDP of the USVI grew at an average annual rate of 2.9 percent. Real GDP decreased in 2003, and then grew at increasing rates from 2004 to 2007. The major factors underlying the strong economic growth were the oil refining industry, tourism, and territorial government spending. The Hovensa oil refinery, located on St. Croix, is one of the worlds largest oil refineries.
| Summary Statistics for the USVI | |||||||
| 2002 | 2003 | 2004 | 2005 | 2006 | 2007 | 2002-2007 AAGR 1 |
|
| GDP (millions of dollars) | 3,085 | 3,248 | 3,605 | 4,240 | 4,298 | 4,580 | 8.2% |
| Real GDP (millions of chained 2005 dollars) | 3,996 | 3,949 | 4,088 | 4,240 | 4,411 | 4,604 | 2.9% |
| Population 2 | 110,026 | 110,740 | 111,459 | 111,470 | 113,689 | 114,743 | 0.8% |
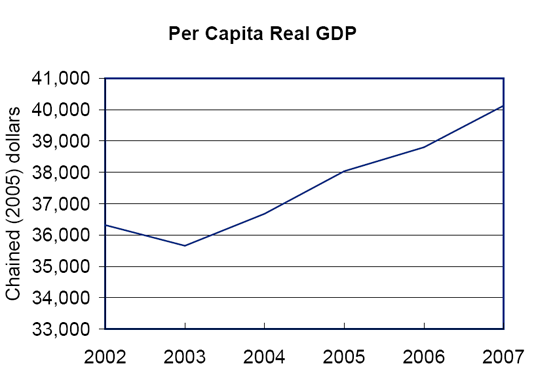
| Real GDP per capita (chained 2005 dollars) | 36,319 | 35,660 | 36,677 | 38,037 | 38,799 | 40,124 | 2.0% |
| 1. Average annual growth rate. 2. Source: 2008 U.S. Virgin Islands Annual Economic Indicators. |
From 2002 to 2007, the population of the USVI increased at an average annual rate of 0.8 percent, and real GDP per capita increased at an average annual rate of 2.0 percent.
| U.S. Virgin Islands Table 1. Gross Domestic Product |
|||||||
|---|---|---|---|---|---|---|---|
| Line |
[Millions of dollars]
|
||||||
| 2002 | 2003 | 2004 | 2005 | 2006 | 2007 | ||
|
Gross domestic product
|
1 | 3,085 | 3,248 | 3,605 | 4,240 | 4,298 | 4,580 |
| Personal consumption expenditures | 2 | 1,121 | 1,176 | 1,255 | 1,414 | 1,592 | 1,657 |
| Private fixed investment | 3 | 435 | 311 | 357 | 445 | 498 | 409 |
| Change in private inventories | 4 | -93 | 27 | 13 | -5 | -55 | -533 |
| Net exports | 5 | 803 | 978 | 1,213 | 1,588 | 1,330 | 2,000 |
| Exports | 6 | 5,106 | 6,831 | 8,993 | 12,073 | 13,170 | 14,496 |
| Goods | 7 | 3,911 | 5,575 | 7,637 | 10,626 | 11,708 | 13,062 |
| Services | 8 | 1,195 | 1,257 | 1,356 | 1,446 | 1,462 | 1,434 |
| Imports | 9 | 4,304 | 5,853 | 7,781 | 10,485 | 11,840 | 12,496 |
| Goods | 10 | 4,140 | 5,651 | 7,547 | 10,243 | 11,615 | 12,251 |
| Services | 11 | 164 | 202 | 234 | 241 | 225 | 244 |
| Government consumption expenditures and gross investment |
12 | 819 | 756 | 768 | 798 | 933 | 1,047 |
| Federal | 13 | 80 | 84 | 98 | 94 | 90 | 100 |
| Territorial | 14 | 739 | 671 | 670 | 704 | 843 | 947 |
| U.S. Virgin Islands Table 2. Real Gross Domestic Product, Chained Dollars |
|||||||
|---|---|---|---|---|---|---|---|
| Line |
[Millions of chained (2005) dollars]
|
||||||
| 2002 | 2003 | 2004 | 2005 | 2006 | 2007 | ||
|
Gross domestic product
|
1 | 3,996 | 3,949 | 4,088 | 4,240 | 4,411 | 4,604 |
| Personal consumption expenditures | 2 | 1,287 | 1,299 | 1,324 | 1,414 | 1,547 | 1,524 |
| Private fixed investment | 3 | 496 | 345 | 378 | 445 | 469 | 373 |
| Change in private inventories | 4 | -184 | 51 | 27 | -5 | -45 | -386 |
| Net exports | 5 | 1,410 | 1,503 | 1,594 | 1,588 | 1,557 | 2,088 |
| Exports | 6 | 9,600 | 11,124 | 11,933 | 12,073 | 11,454 | 11,415 |
| Goods | 7 | 8,253 | 9,849 | 10,550 | 10,626 | 10,054 | 10,077 |
| Services | 8 | 1,241 | 1,286 | 1,389 | 1,446 | 1,402 | 1,330 |
| Imports | 9 | 8,189 | 9,621 | 10,339 | 10,485 | 9,896 | 9,327 |
| Goods | 10 | 7,985 | 9,395 | 10,092 | 10,243 | 9,675 | 9,092 |
| Services | 11 | 200 | 226 | 246 | 241 | 221 | 240 |
| Government consumption expenditures and gross investment |
12 | 870 | 766 | 787 | 798 | 866 | 952 |
| Federal | 13 | 93 | 96 | 102 | 94 | 88 | 92 |
| Territorial | 14 | 775 | 670 | 686 | 704 | 777 | 859 |
| U.S. Virgin Islands Table 3. Percent Change From Preceding Year in Real Gross Domestic Product |
||||||
|---|---|---|---|---|---|---|
| Line |
[Percent]
|
|||||
| 2003 | 2004 | 2005 | 2006 | 2007 | ||
|
Gross domestic product
|
1 | -1.2 | 3.5 | 3.7 | 4.0 | 4.4 |
| Personal consumption expenditures | 2 | 1.0 | 1.9 | 6.8 | 9.4 | -1.5 |
| Private fixed investment | 3 | -30.4 | 9.5 | 17.8 | 5.4 | -20.6 |
| Change in Private Inventories | 4 | ........ | ........ | ........ | ........ | .... |
| Net exports | 5 | ........ | ........ | ........ | ........ | .... |
| Exports | 6 | 15.9 | 7.3 | 1.2 | -5.1 | -0.3 |
| Goods | 7 | 19.3 | 7.1 | 0.7 | -5.4 | 0.2 |
| Services | 8 | 3.6 | 8.0 | 4.1 | -3.1 | -5.1 |
| Imports | 9 | 17.5 | 7.5 | 1.4 | -5.6 | -5.8 |
| Goods | 10 | 17.6 | 7.4 | 1.5 | -5.6 | -6.0 |
| Services | 11 | 13.0 | 8.9 | -1.8 | -8.2 | 8.7 |
| Government consumption | ||||||
| expenditures and gross investment | 12 | -11.9 | 2.8 | 1.3 | 8.5 | 9.9 |
| Federal | 13 | 3.3 | 5.6 | -7.8 | -5.8 | 4.1 |
| Territorial | 14 | -13.6 | 2.4 | 2.7 | 10.4 | 10.6 |
| U.S. Virgin Islands Table 4. Contributions to Percent Change in Real Gross Domestic Product |
||||||
|---|---|---|---|---|---|---|
| Line | ||||||
| 2003 | 2004 | 2005 | 2006 | 2007 | ||
| Percent change: | ||||||
| Gross domestic product | 1 | -1.2 | 3.5 | 3.7 | 4.0 | 4.4 |
| Percentage points: | ||||||
| Personal consumption expenditures | 2 | 0.35 | 0.70 | 2.31 | 3.24 | -0.57 |
| Private fixed investment | 3 | -4.24 | 0.90 | 1.72 | 0.60 | -2.40 |
| Change in private inventories | 4 | 3.93 | -0.67 | -0.63 | -1.06 | -10.29 |
| Net exports | 5 | 1.93 | 1.97 | 0.04 | -0.43 | 15.50 |
| Exports | 6 | 27.45 | 16.52 | 3.17 | -15.96 | -1.08 |
| Goods | 7 | 26.09 | 13.49 | 1.69 | -14.87 | 0.66 |
| Services | 8 | 1.36 | 3.03 | 1.49 | -1.09 | -1.74 |
| Imports | 9 | -25.52 | -14.54 | -3.13 | 15.52 | 16.58 |
| Goods | 10 | -24.82 | -13.99 | -3.25 | 15.04 | 17.03 |
| Services | 11 | -0.70 | -0.55 | 0.12 | 0.48 | -0.45 |
| Government consumption | ||||||
| expenditures and gross investment | 12 | -3.15 | 0.62 | 0.28 | 1.69 | 2.16 |
| Federal | 13 | 0.08 | 0.15 | -0.20 | -0.13 | 0.09 |
| Territorial | 14 | -3.24 | 0.48 | 0.48 | 1.83 | 2.07 |
| U.S. Virgin Islands Table 5. Percent Change From Preceding Year in Prices for Gross Domestic Product and Price Indexes for Gross Domestic Product |
|||||||
|---|---|---|---|---|---|---|---|
| Line |
2002
|
2003
|
2004
|
2005
|
2006
|
2007
|
|
|
[Percent]
|
|||||||
| Gross domestic product | 1 | …….. | 6.6 | 7.2 | 13.4 | -2.6 | 2.1 |
| Personal consumption expenditures | 2 | …….. | 4.0 | 4.7 | 5.5 | 2.9 | 5.7 |
|
[Index numbers, 2005=100]
|
|||||||
| Gross domestic product | 3 | 77.2 | 82.3 | 88.2 | 100.0 | 97.4 | 99.5 |
| Personal consumption expenditures | 4 | 87.1 | 90.6 | 94.8 | 100.0 | 102.9 | 108.7 |
| U.S. Virgin Islands Table 6. Gross Domestic Income |
|||||||
|---|---|---|---|---|---|---|---|
| Line |
[Millions of dollars]
|
||||||
| 2002 | 2003 | 2004 | 2005 | 2006 | 2007 | ||
| Gross domestic income | 1 | 3,085 | 3,248 | 3,605 | 4,240 | 4,298 | 4,580 |
| Compensation of employees | 2 | 1,684 | 1,673 | 1,769 | 1,911 | 2,043 | 2,154 |
| Taxes on production and imports less subsidies | 3 | 61 | 100 | 122 | 143 | 146 | 153 |
| Gross operating surplus | 4 | 1,340 | 1,474 | 1,714 | 2,186 | 2,108 | 2,272 |