
News Release
Gross Domestic Product by Metropolitan Area, 2012 and Revised 2001-2011
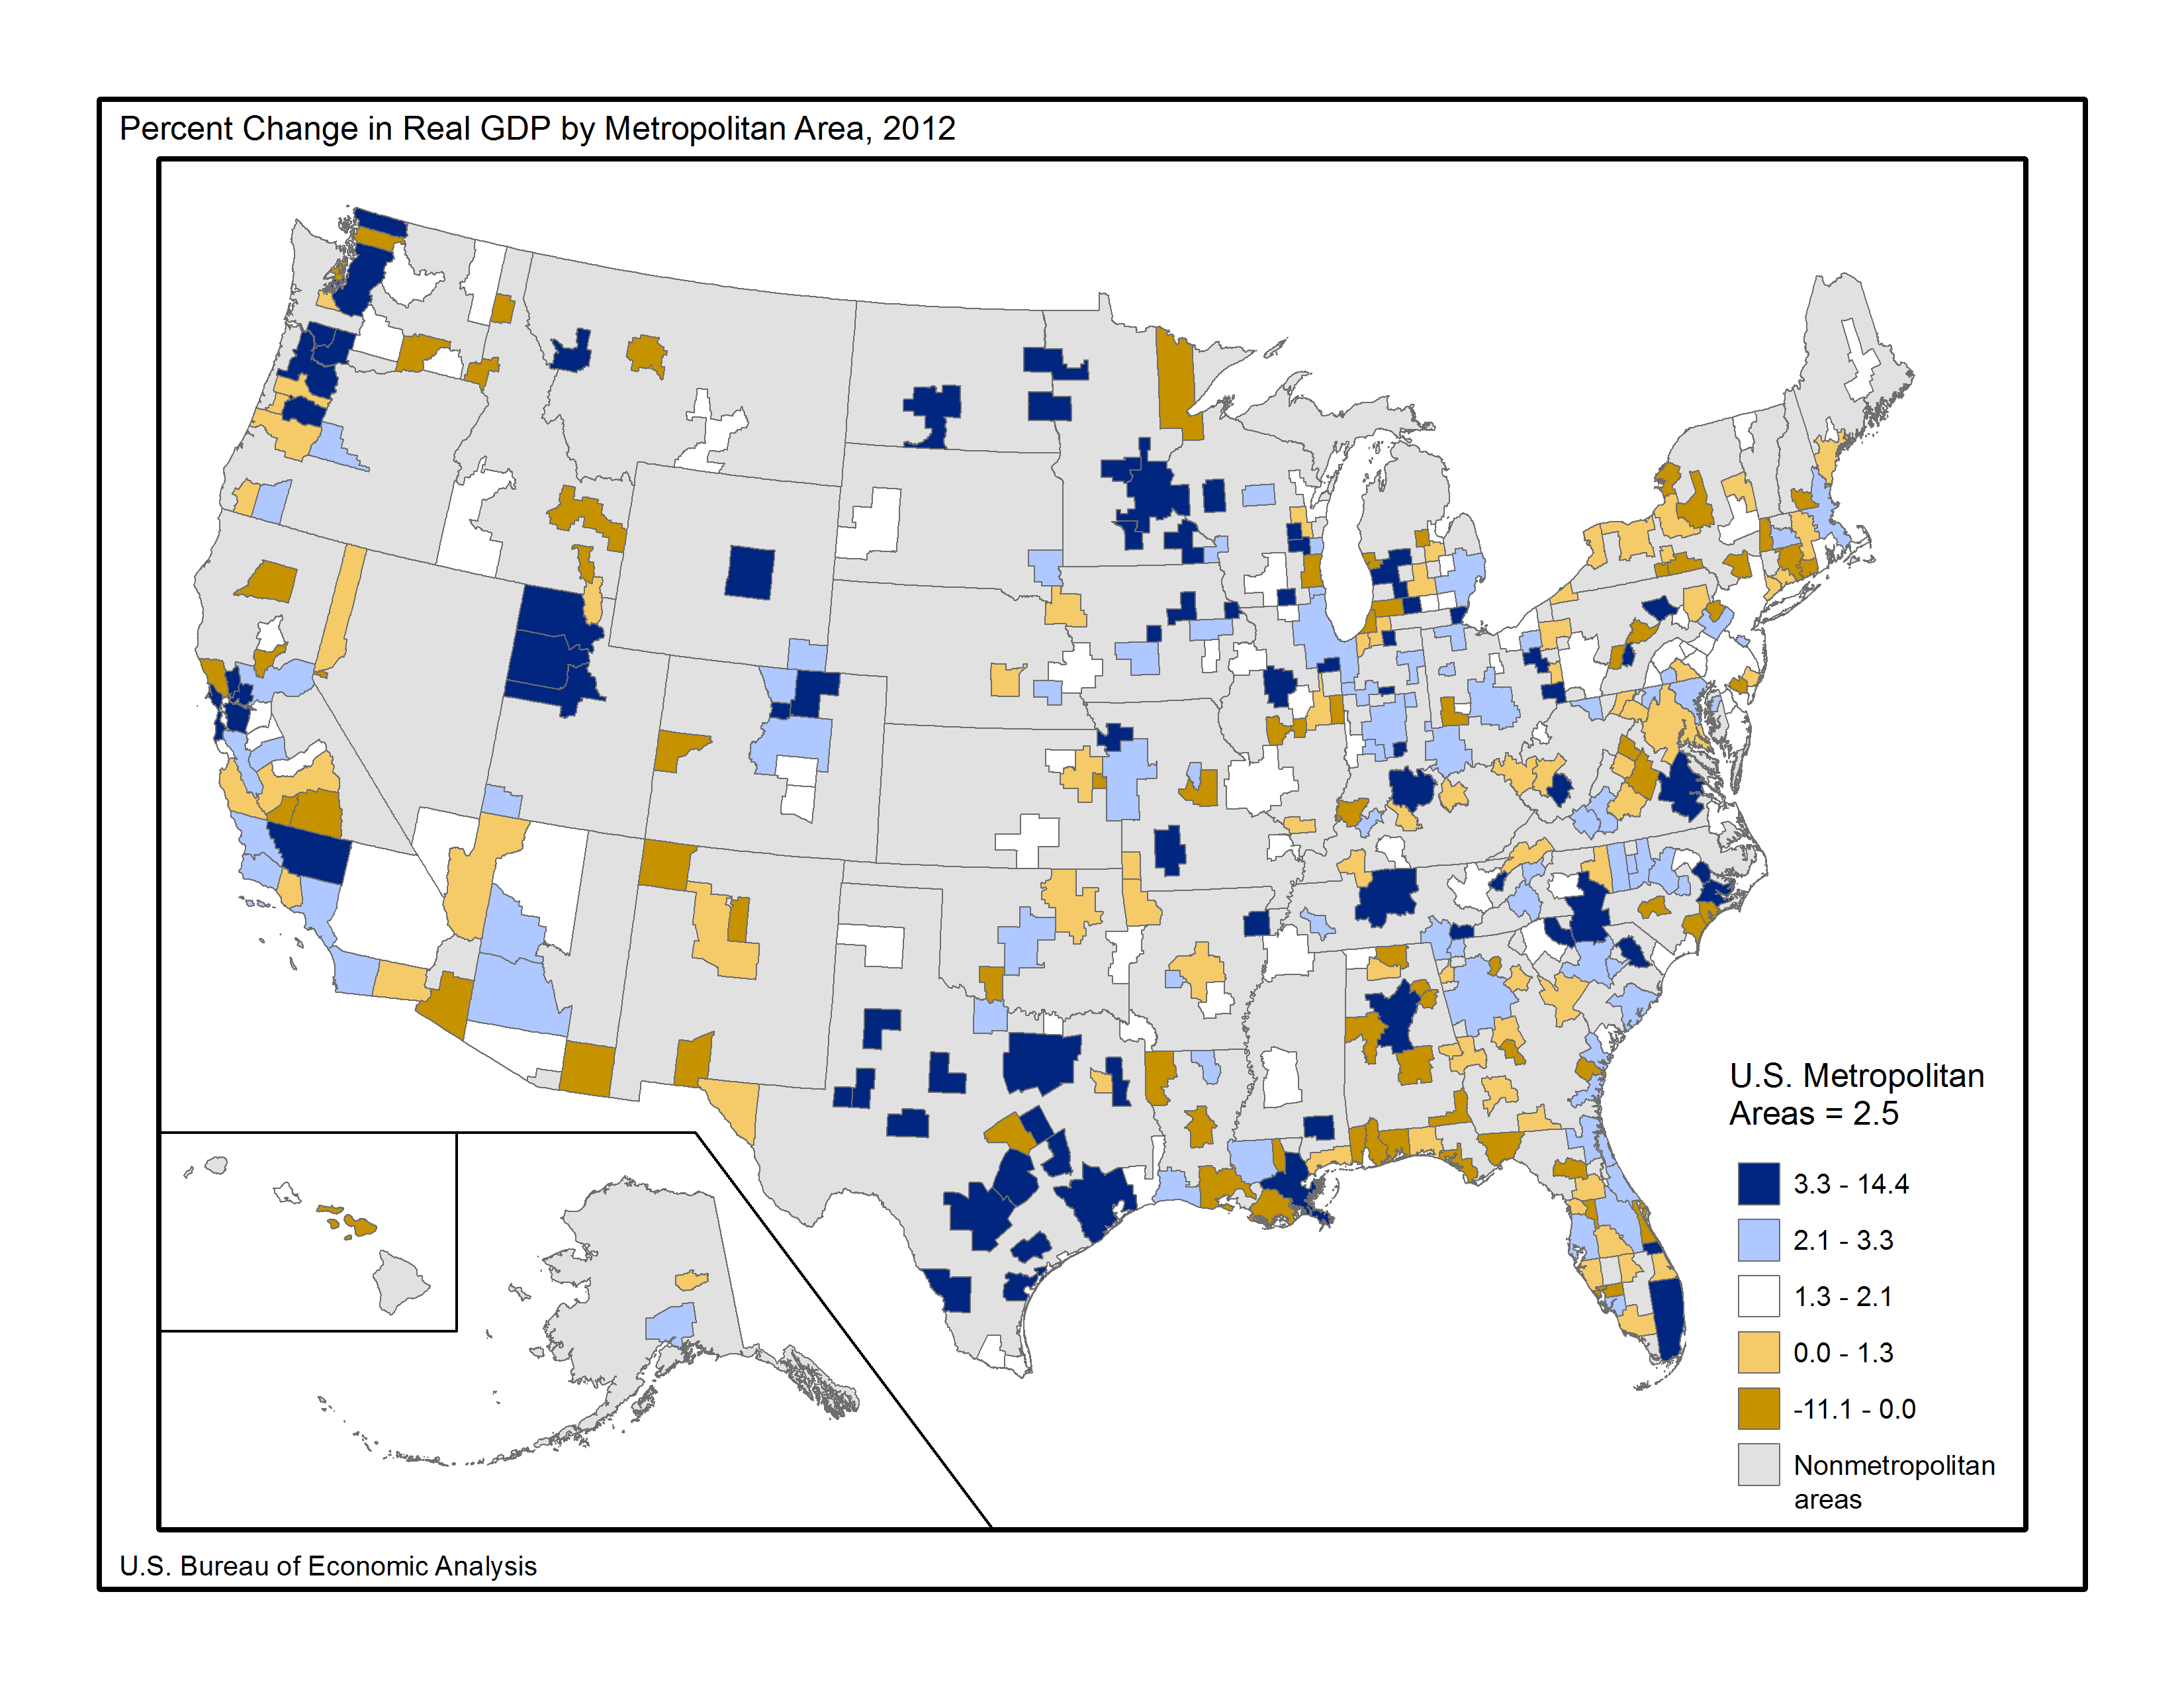
ECONOMIC GROWTH WIDESPREAD ACROSS METROPOLITAN AREAS IN 2012
Advance 2012, and Revised 20012011 GDP-by-Metropolitan-Area Statistics
Real GDP increased in 305 of the nations 381 metropolitan areas in 2012, led by growth in durable-goods manufacturing, trade, and financial activities, according to new statistics released today by the U.S. Bureau of Economic Analysis. Real GDP in metropolitan areas increased 2.5 percent in 2012 after increasing 1.7 percent in 2011.1 Todays release of GDP by metropolitan area represents a return to the previous release schedule, publishing 9 rather than 14 months after the end of the calendar year.2
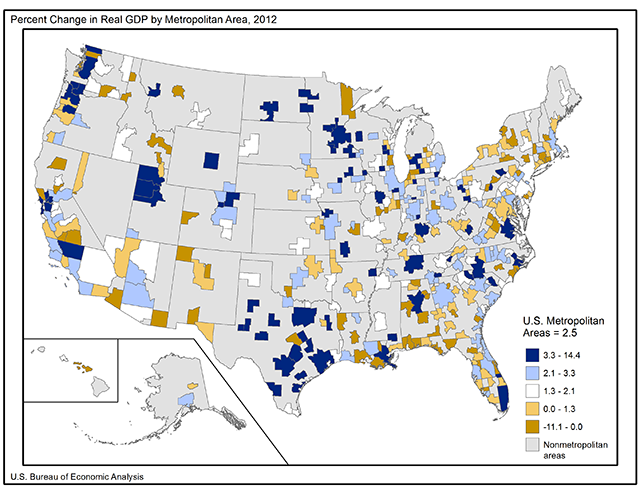
Of the ten largest metropolitan areas, the three with the fastest real GDP growth in 2012 were San Francisco-Oakland-Hayward, CA (7.4 percent), Houston-The Woodlands-Sugar Land, TX (5.3 percent), and Dallas-Fort Worth-Arlington, TX (4.3 percent).3 The ten largest metropolitan areas, accounting for 34 percent of national GDP, averaged 3.1 percent growth in 2012 after growing 1.9 percent in 2011.
Durable-goods manufacturing continued to spur growth in many of the nations metropolitan areas in 2012. Strong contributions from this industry fueled growth in many small metropolitan areas where it constitutes a large portion of the areas economy.4 This is especially true in the Great Lakes region where durable-goods manufacturing contributed 8.5 percentage points to growth in Elkhart-Goshen, IN, 8.3 percentage points to growth in Columbus, IN and 7.2 percentage points in Kokomo, IN. Elkhart-Goshen, IN and Columbus, IN were two of the fastest growing metropolitan areas in 2012, with overall real GDP growth of 11.4 percent and 9.6 percent, respectively.
The effect of the growth in trade (wholesale and retail) was widespread—363 of the nations 381 metropolitan areas experienced positive contributions to growth. The strongest contributions from this industry occurred in the Southwest region. One of the largest contributions occurred in Odessa, TX (3.1 percentage points).
In 2012, the financial activities industry was a strong contributor to growth in many metropolitan areas. Notable contributions to growth from this industry occurred in Missoula, MT (3.4 percentage points); Eau Claire, WI (2.3 percentage points); Bloomington, IL (2.3 percentage points); Minneapolis-St. Paul-Bloomington, MN-WI (2.0 percentage points); and Ocean City, NJ (2.0 percentage points).
Although natural resources and mining was not a major contributor to growth for the nation, several metropolitan areas in the Southwest region experienced strong growth spurred by this industry. Notable contributions to growth occured in Laredo, TX (2.6 percentage points); San Angelo, TX (2.2 percentage points); Corpus Christi, TX (2.2 percentage points); and Longview, TX (2.1 percentage points).
Tables 1-3 (XLS) show these results in more detail; complete detail is available on BEA's Web site at www.bea.gov.
Advance Statistics of GDP by Metropolitan Area for 2012 by NAICS Sector
The advance statistics of GDP by metropolitan area for 2012 are based on source data that are incomplete or subject to further revision by the source agency. Revised statistics, based on more complete data, will be released in September 2014.
As part of the 5-month acceleration in the releasse of BEAs 2012 local area personal income statistics the August release of advance metropolitan area personal income was discontinued. The loss of this data source necessitated a delay in the release of 2011 advance GDP-by-metropolitan-area statistics until February 2013. To improve the timeliness of the release of advance GDP-by-metropolitan-area statistics and return to the previous September release date, a new data source was identified and the advance GDP methodology was modified. More information on the methodology used to produce these advance 2012 statistics, on the revised GDP-by-metropolitan-area statistics for 2001–2011, and on revisions to the GDP-by-metropolitan-area statistics will appear in an article in the October 2013 issue of the Survey of Current Business, BEA's monthly journal.
Explanatory Notes
Definitions. GDP by metropolitan area is the sub-state counterpart of the Nation's gross domestic product (GDP), the Bureau's featured and most comprehensive measure of U.S. economic activity. GDP by metropolitan area is derived as the sum of the GDP originating in all the industries in the metropolitan area.
The statistics of real GDP by metropolitan area are prepared in chained (2005) dollars. Real GDP by metropolitan area is an inflation-adjusted measure of each area's gross product that is based on national prices for the goods and services produced within the metropolitan area. The statistics of real GDP by metropolitan area and of quantity indexes with a base year of 2005 were derived by applying national chain-type price indexes to the current-dollar GDP-by-metropolitan-area values for the 61 detailed NAICS-based industries.
The chain-type index formula that is used in the national accounts is then used to calculate the values of total real GDP by metropolitan area and of real GDP by metropolitan area at more aggregated industry levels. Real GDP by metropolitan area may reflect a substantial volume of output that is sold to other areas and countries. To the extent that a metropolitan area's output is produced and sold in national markets at relatively uniform prices (or sold locally at national prices), real GDP by metropolitan area captures the differences across metropolitan areas that reflect the relative differences in the mix of goods and services that the areas produce. However, real GDP by metropolitan area does not capture geographic differences in the prices of goods and services that are produced and sold locally.
Relation of GDP by metropolitan area real growth rates to national GDP. Following typical procedures, the GDP-by-metropolitan-area statistics released today are consistent with statistics of GDP by state released June 6, 2013, which are based on the annual revision of the national income and product accounts (NIPAs) released in July 2012 and BEAs national GDP-by-industry statistics released April 25, 2013. As is normally the case, the growth rate of real GDP in the nations metropolitan areas differs from the nations real GDP growth rates released in July 2013. In part, the difference is caused by the inclusion of nonmetropolitan areas in the national statistics. In addition, growth rates differ because of differences in the timing of production cycles and availability of data in preparing national and regional statistics, which preclude BEA from incorporating the immediately preceding July annual revisions to the NIPAs into the advance GDP-by-metropolitan-area statistics.
Metropolitan (statistical) areas. The metropolitan (statistical) areas used by BEA for its entire series of GDP statistics are the county-based definitions developed by the Office of Management and Budget (OMB) for federal statistical purposes and last updated in February 2013. OMB's general concept of a metropolitan area is that of a geographic area consisting of a large population nucleus together with adjacent communities having a high degree of economic and social integration with the nucleus.
The statistics of GDP by metropolitan area in current and real (chained) dollars are available from the Regional Economic Accounts page of the BEA Web site at /regional/index.htm.
BEA's national, international, regional, and industry statistics; the Survey of Current Business; and BEA news releases are available without charge on BEA's Web site at www.bea.gov. By visiting the site, you can also subscribe to receive free e-mail summaries of BEA releases and announcements.
Footnotes
1. The GDP data in this release do not incorporate the new concepts and definitions that were part of the comprehensive revision to the National Income and Product Accounts released in July 2013. Those changes, along with statistical revisions, will be included in the September 2014 release of GDP by metropolitan area. See the box above.
2. See section on Advance Statistics of GDP by Metropolitan Area for 2012 by NAICS Sector.
3. The ten largest metropolitan areas, as measured by 2012 real GDP, are: New York-Northern New Jersey-Long Island, NY-NJ-PA; Los Angeles-Long Beach-Santa Ana, CA; Chicago-Joliet-Naperville, IL-IN-WI; Washington-Arlington-Alexandria, DC-VA-MD-WV; Houston-Sugar Land-Baytown, TX; Dallas-Fort Worth-Arlington, TX; Philadelphia-Camden-Wilmington, PA-NJ-DE-MD; Boston-Cambridge-Quincy, MA-NH; San Francisco-Oakland-Fremont, CA; and Atlanta-Sandy Springs-Marietta, GA. The real GDP produced by each of these metropolitan areas exceeds $249 billion.
4. Small metropolitan areas are those with real GDP of less than $10 billion.