
News Release
Travel and Tourism Satellite Accounts, 3rd quarter 2013
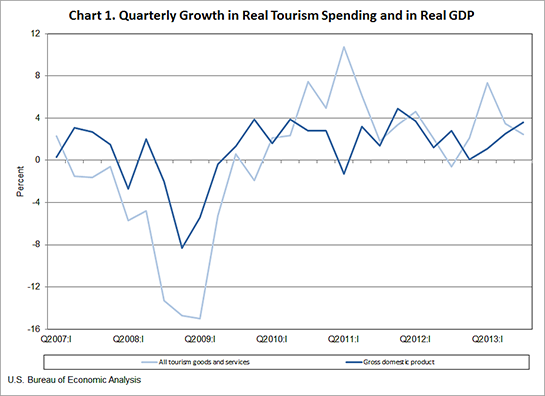
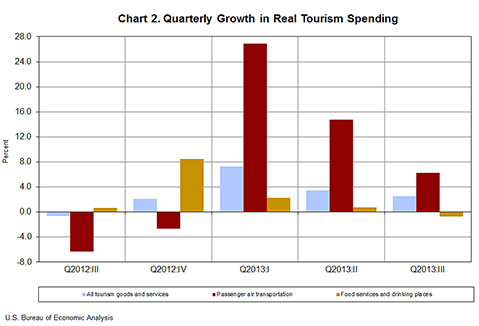
Real spending on travel and tourism decelerated in the third quarter of 2013, increasing at an annual rate of 2.5 percent after increasing 3.5 percent (revised) in the second quarter of 2013. By comparison, growth in real gross domestic product (GDP) accelerated, increasing 3.6 percent (second estimate) in the third quarter after increasing 2.5 percent in the second quarter.
The leading contributors to the deceleration in the third quarter were passenger air transportation, and all other transportation-related commodities. Passenger air transportation decelerated, increasing 6.2 percent in the third quarter after increasing 14.8 percent; growth in both domestic and international passenger air transportation slowed. All other transportation-related commodities decelerated in the third quarter, increasing 1.5 percent after increasing 3.7 percent, primarily reflecting slowdowns in travel arrangement and reservation services and in automotive rental and leasing.
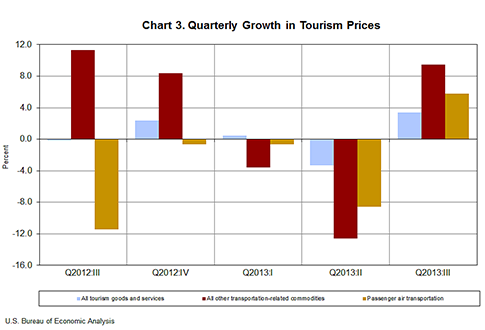
Overall growth in prices for travel and tourism goods and services turned up in the third quarter of 2013, increasing 3.4 percent following a 3.3 percent (revised) decrease in the second quarter. The third quarter upturn in prices was concentrated in transportation, primarily reflecting an upturn in the price for gasoline.
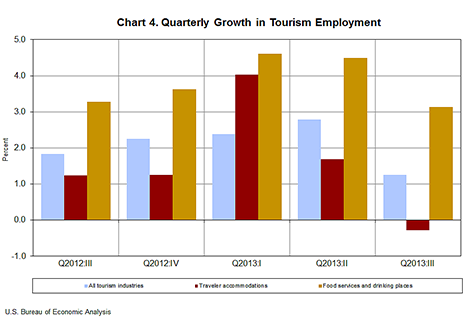
Employment in the travel and tourism industries decelerated, increasing 1.3 percent in the third quarter of 2013 after increasing 2.8 percent (revised) in the second quarter. By comparison, overall U.S. employment increased 1.4 percent in the third quarter after increasing 1.7 percent in the second quarter.
Total Tourism-Related Spending in the U.S. includes the goods and services that are purchased directly by tourists and also a portion of the goods and services produced by the supply chain that supports tourism activity; for example, a firm that supplies linens to hotels and restaurants.
In the third quarter of 2013, total current-dollar tourism-related spending was $1.5 trillion and consisted of $903.0 billion (59 percent) of direct tourism spending goods and services sold directly to visitors and $616.6 billion (41 percent) of indirect tourism-related spending goods and services used to produce what visitors purchase.
Total Tourism-Related Employment was 8.0 million jobs in the third quarter of 2013 and consisted of 5.7 million (72 percent) direct tourism jobs jobs where workers produce goods and services sold directly to visitors and 2.3 million (28 percent) indirect tourism-related jobs jobs where workers produce goods and services used to produce what visitors purchase.
Definitions
Tourism spending. Tourism spending comprises all goods and services purchased by tourists (defined as people who travel for any reason). In the following tables, tourism spending is referred to as direct tourism output.
Indirect tourism-related spending. Indirect tourism-related spending comprises all output used as inputs in the process of producing direct tourism output (e.g., toiletries for hotel guests and the plastic used to produce souvenir key chains).
Total tourism-related spending. Total tourism-related spending is the sum of direct tourism spending and indirect tourism-related spending.
Direct tourism employment. Direct tourism employment comprises all jobs where the workers are engaged in the production of direct tourism output (such as hotel staff, airline pilots, and souvenir sellers).
Indirect tourism-related employment. Indirect tourism-related employment comprises all jobs where the workers are engaged in the production of indirect tourism-related output (e.g., employees of companies that produce toiletries for hotel guests and the plastic used to produce souvenir key chains).
Total tourism-related employment. Total tourism-related employment is the sum of direct tourism employment and indirect tourism-related employment.
These statistics are from BEAs Travel and Tourism Satellite Accounts (TTSAs), which are supported by funding from the Office of Travel and Tourism Industries, International Trade Administration, U.S. Department of Commerce. The current-price statistics of direct tourism output were derived from BEAs annual TTSAs and from current-price quarterly statistics of personal consumption expenditures from the National Income and Product Accounts (NIPAs). The real statistics of direct tourism output were developed using price indexes from the Bureau of Labor Statistics (BLS) and real quarterly statistics of personal consumption expenditures from the NIPAs. The statistics of direct tourism employment were derived from the annual TTSAs (revised in June 2013) from BEA, the Quarterly Census of Employment and Wages (QCEW), and Current Employment Statistics (CES) from BLS.
Quarterly statistics are seasonally adjusted and expressed at annual rates, unless otherwise specified. Percent changes are calculated from unrounded data and annualized. Real values are in chained (2005) dollars. Price indexes are Fisher chain-type measures. Growth in overall U.S. employment is calculated using BLS total nonfarm employment from Current Employment Statistics, www.bls.gov/ces/home.htm#data.
* * *
Next release Travel and Tourism statistics for fourth quarter and annual 2013 will be released on Thursday, March 20, 2014 at 8:30 A.M. EDT.
BEA’s national, international, regional, and industry statistics; the Survey of Current Business; and BEA news releases are available without charge on BEA’s Web site at www.bea.gov. By visiting the site, you can also subscribe to receive free e-mail summaries of BEA releases and announcements.