
News Release
Gross Domestic Product by Metropolitan Area, Advance 2014 and Revised 2001-2013
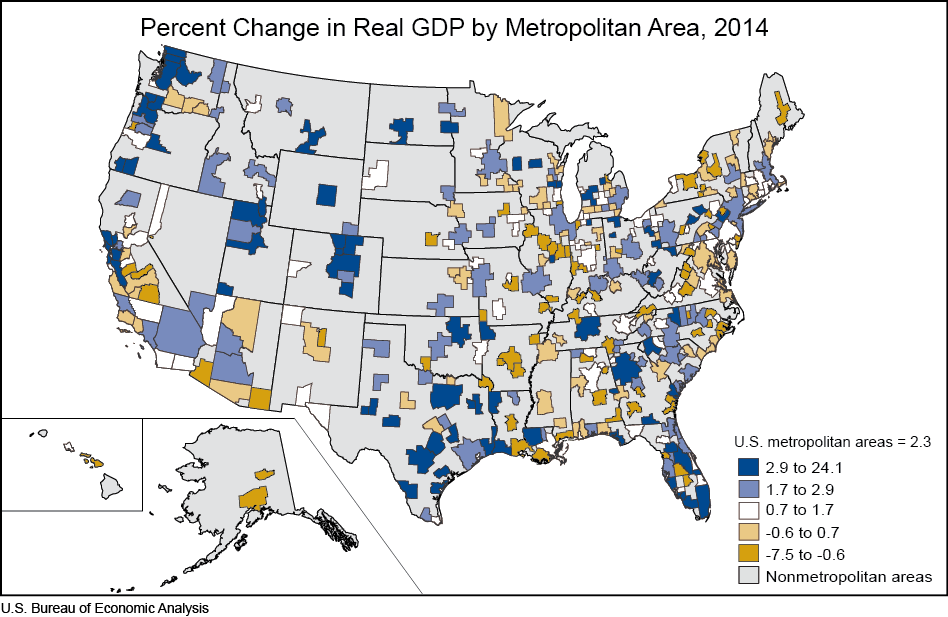
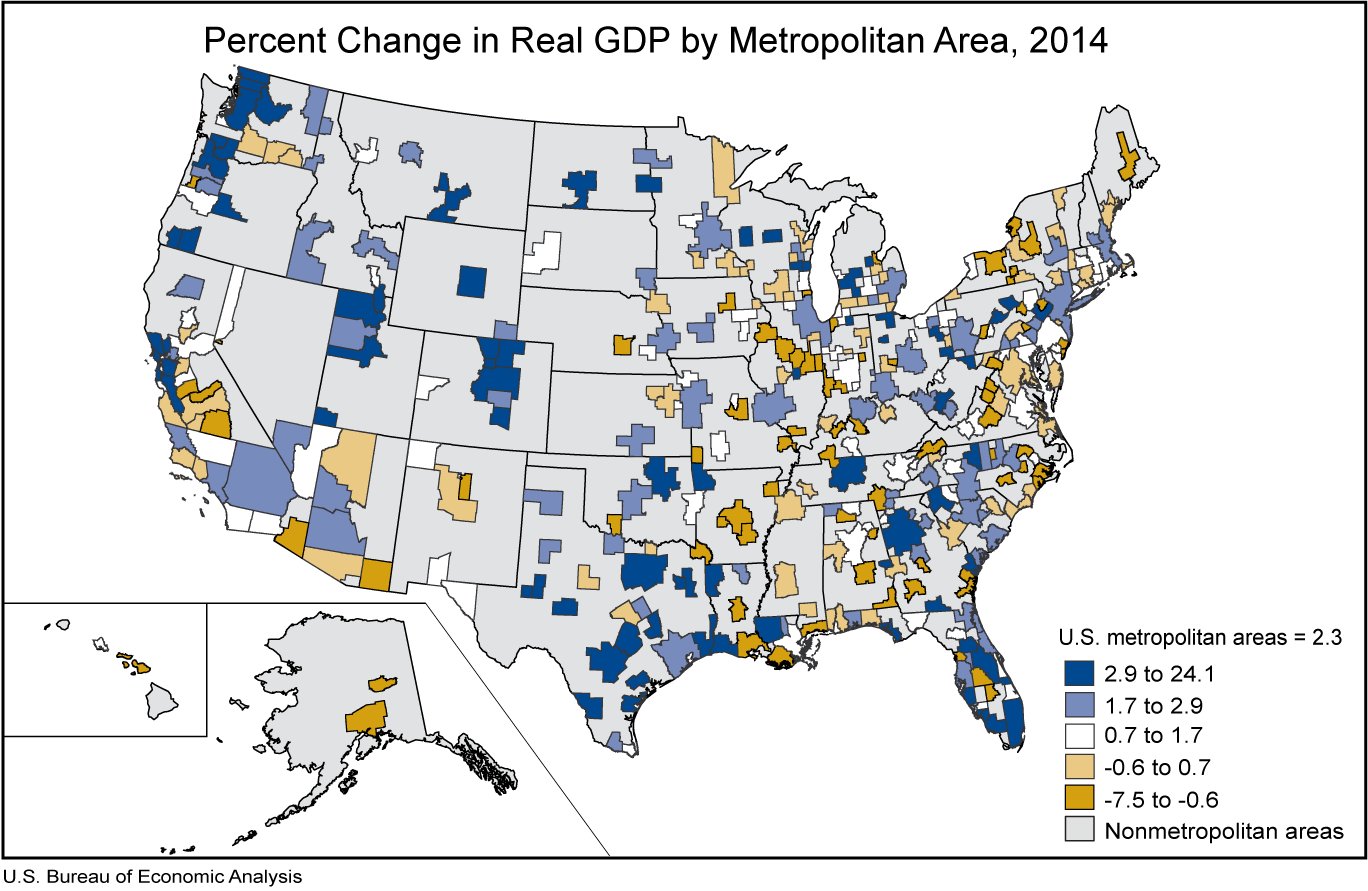
Economic Growth Widespread Across Metropolitan Areas in 2014
Real GDP increased in 282 of the nation's 381 metropolitan areas in 2014, led by growth in several industry groups: professional and business services, wholesale and retail trade, and the group of finance, insurance, real estate, rental, and leasing. Natural resources and mining remained a strong contributor to growth in several metropolitan areas. Collectively, real GDP for U. S. metropolitan areas increased 2.3 percent in 2014 after increasing 1.9 percent in 2013.
Professional and business services contributed 0.61 percentage point to U.S. metropolitan area real GDP growth in 2014. This industry contributed to growth in 314 of the nation's 381 metropolitan areas. Growth in this industry accounted for more than half of real GDP growth in 49 metropolitan areas, and contributed more than one percentage point to growth in 28 metropolitan areas, most notably in Midland, MI (4.56 percentage points) and San Francisco-Oakland-Hayward, CA (2.05 percentage points).
Wholesale and retail trade contributed 0.34 percentage point to U.S. metropolitan area real GDP growth in 2014. This industry contributed to growth in 323 metropolitan areas and contributed more than one percentage point to growth in 16 metropolitan areas. The largest contributions from this industry occurred in Battle Creek, MI (2.85 percentage points) and Mobile, AL (1.96 percentage point).
Finance, insurance, real estate, rental, and leasing contributed 0.34 percentage point to U.S. metropolitan area real GDP growth in 2014. This industry contributed to growth in 188 metropolitan areas and contributed more than one percentage point to growth in 41 metropolitan areas, most notably in Naples-Immokalee-Marco Island, FL (3.84 percentage points) and Panama City, FL (3.46 percentage points).
Although natural resources and mining was not a major contributor to growth for the nation, this industry contributed to strong growth in several of the fastest growing metropolitan areas. Mining in the Permian Basin and Cline formation led to notable growth in total real GDP for Midland, TX (24.1 percent) and San Angelo, TX (11.4 percent). Mining in the Marcellus shale formation contributed significantly to the 9.5 percent increase in total real GDP for Wheeling, WV.1
The government sector subtracted 0.01 percentage point from U.S. metropolitan area real GDP growth in 2014. This sector subtracted from growth in 236 metropolitan areas. The largest subtractions occurred in Jacksonville, NC (1.64 percentage point), Hinesville, GA (1.40 percentage point), and Clarksville, TN-KY (1.09 percentage point).
Tables 1–3 show these results in more detail; complete detail is available on the BEA Web site at www.bea.gov.
1The location of these formations can be found on the following map released by the EIA: http://www.eia.gov/oil_gas/rpd/shale_gas.jpg.
Advance Statistics of GDP by Metropolitan Area for 2014 by NAICS Sector
The advance statistics of GDP by metropolitan area for 2014 are based on source data that are incomplete or subject to further revision by the source agency. Revised statistics, based on more complete data, will be released in 2016.
More information on the methodology used to produce these advance 2014 statistics, on the revised statistics of GDP by metropolitan area for 2001–2013, and on revisions to these statistics will appear in an article in the October 2015 issue of the Survey of Current Business, BEA's monthly journal.
Explanatory Notes
Definitions. GDP by metropolitan area is the sub-state counterpart of the Nation's gross domestic product (GDP), the Bureau's featured and most comprehensive measure of U.S. economic activity. GDP by metropolitan area is derived as the sum of the GDP originating in all the industries in the metropolitan area.
The statistics of real GDP by metropolitan area are prepared in chained (2009) dollars. Real GDP by metropolitan area is an inflation-adjusted measure of each area's gross product that is based on national prices for the goods and services produced within the metropolitan area. The statistics of real GDP by metropolitan area and of quantity indexes with a reference year of 2009 were derived by applying national chain-type price indexes to the current-dollar GDP-by-metropolitan-area values for the 61 detailed NAICS-based industries.
The Fisher chain-type price index formula that is used in the national accounts is then used to calculate the values of total real GDP by metropolitan area and of real GDP by metropolitan area at more aggregated industry levels. Real GDP by metropolitan area captures the differences across metropolitan areas that reflect the relative differences in the mix of goods and services that the areas produce. However, real GDP by metropolitan area does not capture geographic differences in the prices of goods and services that are produced and sold locally.
Relation of GDP by metropolitan area real growth rates to national GDP. The statistics of GDP by metropolitan area released today are consistent with statistics of GDP by state released June 10, 2015, which were based on the annual revision of the national income and product accounts (NIPAs) released on July 30, 2014, and BEA's national statistics of GDP by industry released on November 13, 2014. The growth rate of real GDP in the nation's metropolitan areas differs from the nation's real GDP growth rates released in July 2015. In part, the difference is caused by the inclusion of nonmetropolitan areas in the national statistics. In addition, growth rates differ because of differences in the timing of production cycles and availability of data in preparing national and regional statistics, which currently preclude BEA from incorporating the immediately preceding July annual revisions of the NIPAs into the advance statistics of GDP by metropolitan area.
Metropolitan (statistical) areas. The metropolitan (statistical) areas used by BEA for its entire series of GDP statistics are the county-based definitions developed by the Office of Management and Budget (OMB) for federal statistical purposes and last updated in February 2013. OMB's general concept of a metropolitan area is that of a geographic area consisting of a large population nucleus together with adjacent communities having a high degree of economic and social integration with the nucleus.
The statistics of GDP by metropolitan area in current and real (chained) dollars are available from the Regional Economic Accounts page of the BEA Web site at /regional/index.htm.
BEA's national, international, regional, and industry statistics; the Survey of Current Business; and BEA news releases are available without charge on BEA's Web site at www.bea.gov. By visiting the site, you can also subscribe to receive free e-mail summaries of BEA releases and announcements.