
News Release
State Quarterly Personal Income, 1st quarter 2015 - 3rd quarter 2015
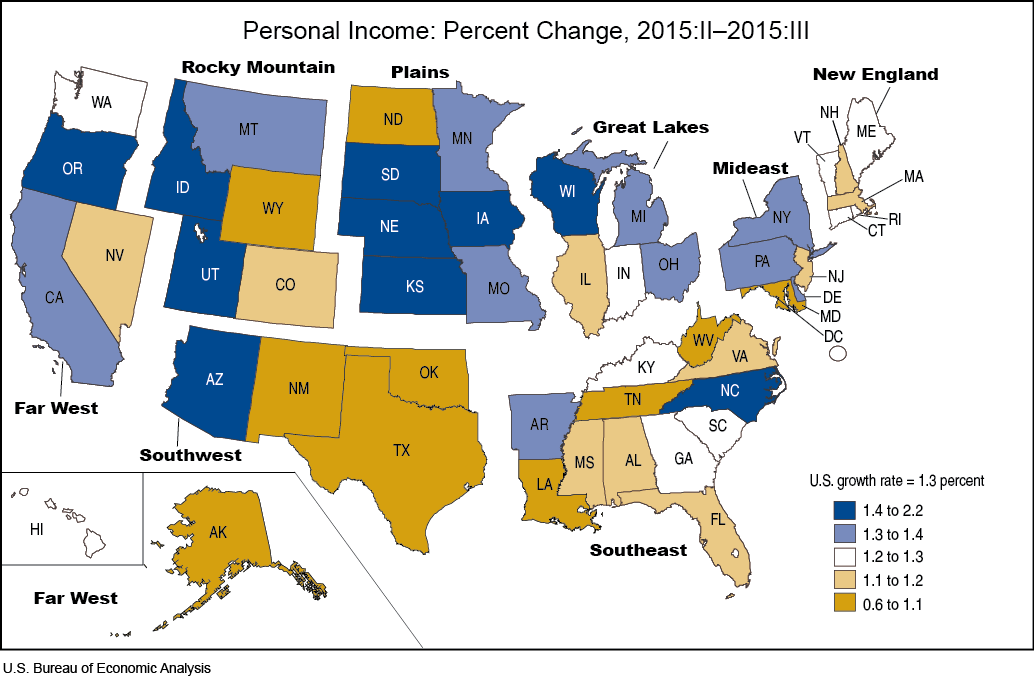
State personal income grew 1.3 percent on average in the third quarter of 2015, the same pace as in the second quarter, according to estimates released today by the U.S. Bureau of Economic Analysis. Personal income grew in every state with third-quarter personal income growth rates ranging from 0.6 percent in Alaska to 2.2 percent in Nebraska and South Dakota (table 1).
Earnings by state and industry. Overall, earnings increased 1.4 percent in the third quarter of 2015 (table 5), after increasing 1.2 percent in the second quarter. Earnings grew in 23 of the 24 industries for which BEA prepares quarterly estimates, with farming, professional services, health care, finance, and retail trade contributing the most to third-quarter personal income growth (table 3). Mining earnings fell for the third consecutive quarter.
Farm earnings grew 17.5 percent in the third quarter after falling 4.5 percent in the second. The increase in farm earnings exceeded 25 percent (table 5) in six of the seven states in the Plains Region (Iowa, Kansas, Minnesota, Missouri, Nebraska, and South Dakota) and contributed the most to their personal income growth. Third-quarter farm earnings primarily reflected lower production expenses, including lower fuel and livestock costs.
Nonfarm earnings grew 1.3 percent in both the second and third quarters. The largest percentage increases in the third quarter were in Arizona and Oregon where nonfarm earnings grew 1.6 percent.
- Earnings in professional services grew 1.7 percent in the third quarter following a 1.8 percent rise in the second. This industry contributed the most to personal income growth in California, Michigan, and Utah.
- Earnings in health care grew 1.6 percent in the third quarter following a 1.4 percent increase in the second. Health care was the leading contributor to personal income growth in New York and North Carolina in the third quarter.
- Earnings in finance grew 1.5 percent in the third quarter following a 1.6 percent rise in the second quarter. Finance was the leading contributor to personal income growth in Arizona, Connecticut, and Delaware in the third quarter.
- Earnings fell 1.9 percent in mining in the third quarter, after falling 5.5 percent in the second quarter and 0.6 percent in the first quarter. This subtracted from personal income growth, particularly in North Dakota, Wyoming, Oklahoma, West Virginia, Alaska, Louisiana, and Texas.
Quarterly state personal income estimates for 2015:I and 2015:II have been revised.
Next quarterly state personal income release – March 24, 2016, at 8:30 A.M. for fourth quarter 2015 and preliminary annual 2015.
Definitions
Personal income is the income received by all persons from all sources. Personal income is the sum of net earnings by place of residence, property income, and personal current transfer receipts. Net earnings by place of residence is earnings by place of work (the sum of wages and salaries, supplements to wages and salaries, and proprietors' income) less contributions for government social insurance, plus an adjustment to convert earnings by place of work to a place-of-residence basis. Property income is rental income of persons, personal dividend income, and personal interest income. Personal current transfer receipts are benefits received by persons from federal, state, and local governments and from businesses for which no current services are performed. They include retirement and disability insurance benefits (mainly Social Security), medical benefits (mainly Medicare and Medicaid), income maintenance benefits, unemployment insurance compensation, veterans' benefits, and federal education and training assistance.
Personal income is measured before the deduction of personal income taxes and other personal taxes and is reported in current dollars (no adjustment is made for price changes).
The estimate of personal income for the United States is the sum of the state estimates and the estimate for the District of Columbia; it differs slightly from the estimate of personal income in the national income and product accounts (NIPAs) because of differences in coverage, in the methodologies used to prepare the estimates, and in the timing of the availability of source data.
Statistical Convention
Quarter-to-quarter percent changes are calculated from unrounded data and are not annualized. Quarterly estimates are expressed at seasonally adjusted annual rates, unless otherwise specified. Quarter-to-quarter dollar changes are differences between published estimates.
BEA Regions
BEA groups all 50 states and the District of Columbia into eight distinct regions for purposes of data collecting and analyses: New England (Connecticut, Maine, Massachusetts, New Hampshire, Rhode Island, and Vermont); Mideast (Delaware, District of Columbia, Maryland, New Jersey, New York, and Pennsylvania); Great Lakes (Illinois, Indiana, Michigan, Ohio, and Wisconsin); Plains (Iowa, Kansas, Minnesota, Missouri, Nebraska, North Dakota, and South Dakota); Southeast (Alabama, Arkansas, Florida, Georgia, Kentucky, Louisiana, Mississippi, North Carolina, South Carolina, Tennessee, Virginia, and West Virginia); Southwest (Arizona, New Mexico, Oklahoma, and Texas); Rocky Mountain (Colorado, Idaho, Montana, Utah, and Wyoming); and Far West (Alaska, California, Hawaii, Nevada, Oregon, and Washington).
Use of State Personal Income Statistics
State personal income statistics provide a framework for analyzing current economic conditions in each state and can serve as a basis for decision making. For example:
- Federal government agencies use the statistics as a basis for allocating funds and determining matching grants to states. The statistics are also used in forecasting models to project energy and water use.
- State governments use the statistics to project tax revenues and the need for public services.
- Academic regional economists use the statistics for applied research.
- Businesses, trade associations, and labor organizations use the statistics for market research.
Resources
The entire historical time series for these estimates can be accessed in BEA's Interactive Data Application at www.bea.gov/itable/. Mapping and charting software are also available.
Further discussion of the regional statistics presented in this news release will be provided in the next issue of the Survey of Current Business, available online at: www.bea.gov/scb/index.htm
Complete information on the sources and methods for the estimation of BEA's State Personal Income and Employment is available online at: www.bea.gov/regional/pdf/spi2014.pdf
BEA Regional Facts (BEARFACTS), a narrative summary of personal income, per capita personal income, and components of income for each state, is available online at: www.bea.gov/regional/bearfacts/
BEA's news release schedules are available at:
www.bea.gov/newsreleases/2015rd.htm
www.bea.gov/newsreleases/2016rd.htm
Stay informed about BEA developments by signing up for our email subscription service or following us on Twitter @BEA_News. You also can access BEA data by registering for our Data Application Programming Interface, or API, at: www.bea.gov/API/signup/index.cfm