
News Release
Travel and Tourism Satellite Accounts, 2nd quarter 2016
Travel and Tourism Spending Accelerated in the Second Quarter
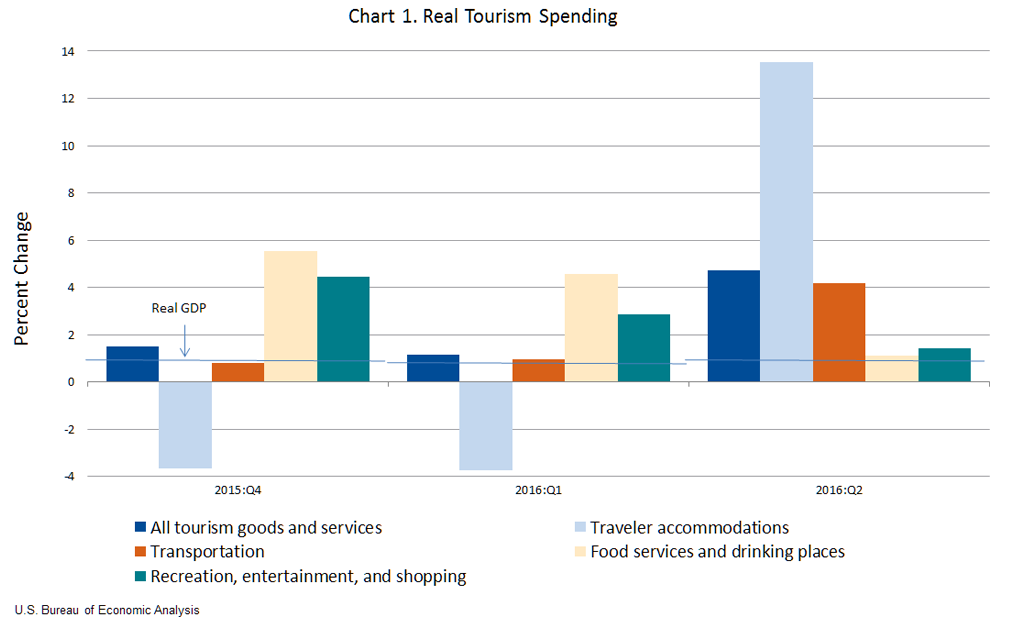
Real spending (output) on travel and tourism accelerated in the second quarter of 2016, increasing at an annual rate of 4.7 percent after increasing 1.2 percent (revised) in the first quarter according to new statistics released by the Bureau of Economic Analysis. By comparison, real gross domestic product (GDP) increased 1.1 percent in the second quarter after increasing 0.8 percent in the first.
The leading contributors to the second-quarter acceleration in travel and tourism were “traveler accommodations” and “transportation.” “Traveler accommodations” turned up after two quarters of decline. The acceleration in “transportation” was driven by an upturn in passenger air transportation services.
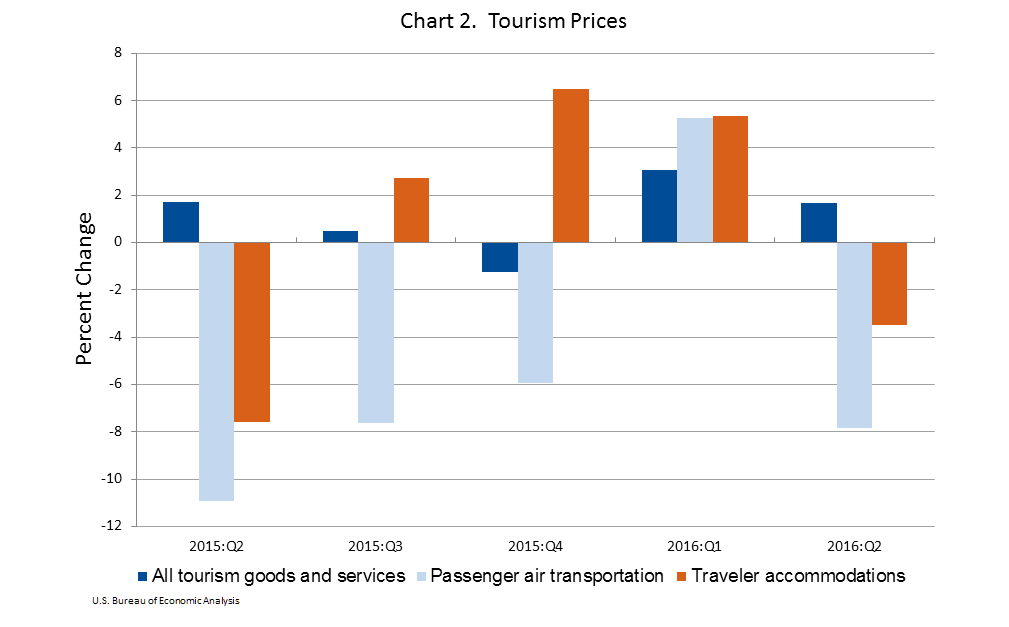
Tourism Prices – Prices for travel and tourism goods and services decelerated in the second quarter of 2016, increasing 1.7 percent following an increase of 3.1 percent (revised) in the first quarter. The deceleration was mainly attributable to a downturn in prices for “passenger air transportation” and “traveler accommodations.” “All other transportation” prices accelerated.
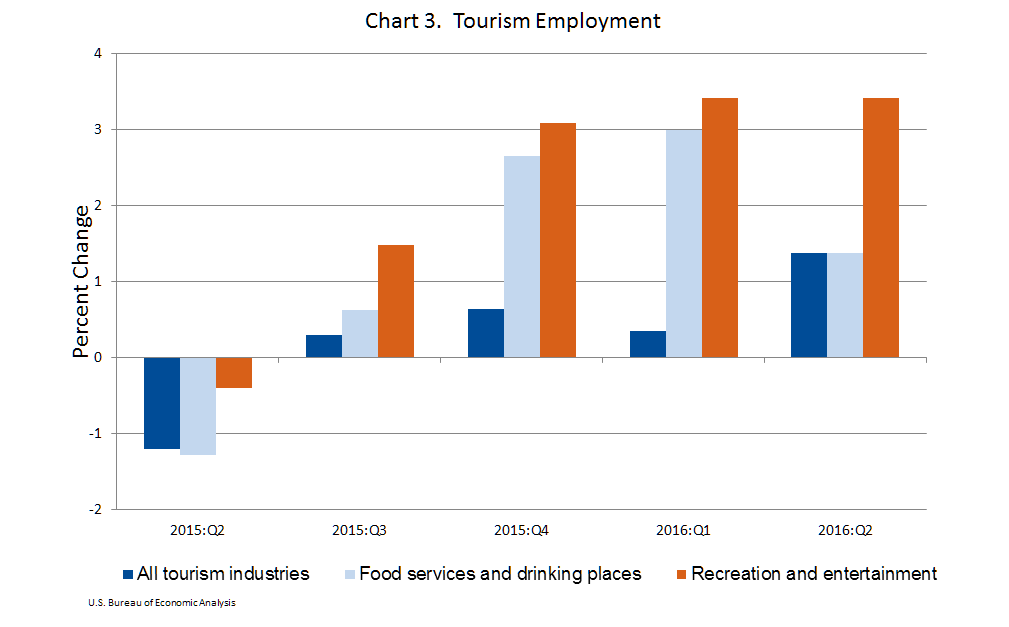
Tourism Employment – Employment in the travel and tourism industries accelerated in the second quarter, increasing 1.4 percent after increasing 0.4 percent in the first quarter. By comparison, overall U.S. nonfarm employment increased 1.3 percent in the second quarter after increasing 1.9 percent in the first. “Food services and drinking places" was the most significant contributor to travel and tourism employment growth, adding 5.6 thousand employees. “Recreation and entertainment” added 5.2 thousand employees.
Total Tourism-Related Output was $1.6 trillion in the second quarter of 2016. It consisted of $934.9 billion (57 percent) of direct tourism spending and $692.6 billion (43 percent) of indirect tourism-related spending.
Total Tourism-Related Employment was 7.6 million jobs in the second quarter of 2016, unchanged from the first quarter, and consisted of 5.4 million (71 percent) direct tourism jobs and 2.2 million (29 percent) indirect tourism-related jobs.
These statistics are from BEA’s Travel and Tourism Satellite Accounts (TTSAs), which are supported by funding from the Office of Travel and Tourism Industries, International Trade Administration, U.S. Department of Commerce. The current-price statistics of direct tourism output were derived from BEA’s annual TTSAs and from current-price quarterly statistics of personal consumption expenditures from the National Income and Product Accounts (NIPAs). The real statistics of direct tourism output were developed using price indexes from the Bureau of Labor Statistics (BLS) and real quarterly statistics of personal consumption expenditures from the NIPAs. The statistics of direct tourism employment were derived from the annual TTSAs from BEA, the Quarterly Census of Employment and Wages (QCEW), and Current Employment Statistics (CES) from BLS.
* * *
Next release: Wednesday, December 14, 2016 at 8:30 A.M. EST
Travel and Tourism statistics: Third Quarter, 2016