
News Release
Gross Domestic Product for Puerto Rico, 2023
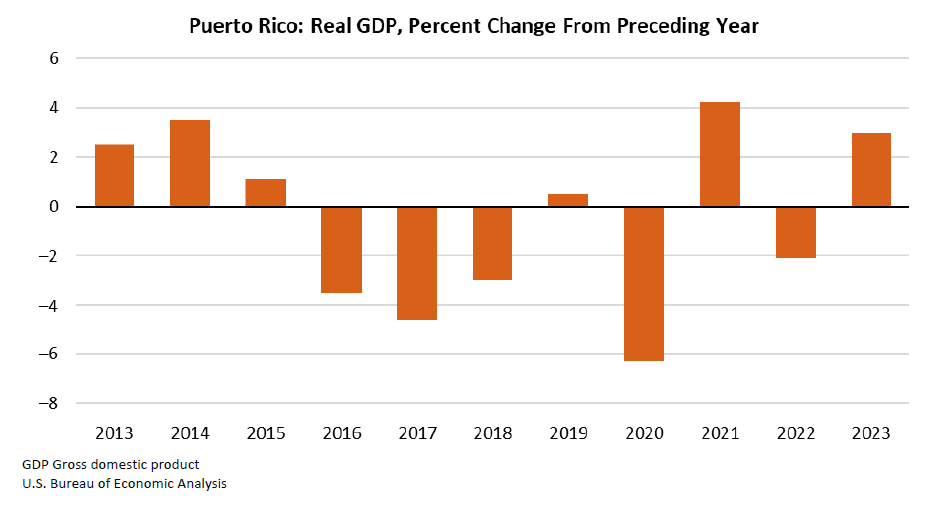
Real gross domestic product for Puerto Rico increased 3.0 percent in 2023 after decreasing 2.1 percent in 2022, according to statistics released today by the U.S. Bureau of Economic Analysis.
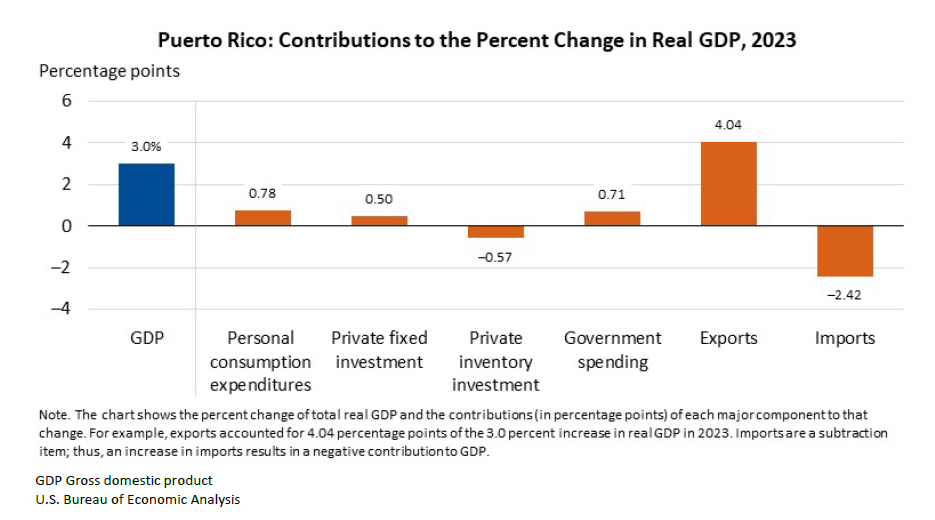
The increase in real gross domestic product (GDP) in 2023 primarily reflected an increase in exports. Personal consumption expenditures, government spending, and private fixed investment also increased. These increases were partly offset by a decrease in private inventory investment. Imports, which are a subtraction in the calculation of GDP, increased.
Real exports increased 6.4 percent, reflecting increases in goods and services. Exports of goods increased 6.6 percent, while exports of services increased 5.6 percent.
- The leading contributor to the increase in exports of goods was pharmaceuticals and organic chemicals, which increased 5.9 percent. Exports of medical and scientific equipment and appliances increased 8.0 percent.
- The leading contributor to the increase in exports of services was travel services, which includes purchases of goods and services by tourists and other nonresidents in Puerto Rico. Exports of travel services increased 15.1 percent, largely reflecting increases in expenditures by air visitors. According to statistics published by the Economic Development Bank for Puerto Rico, total inbound air passengers increased 18.7 percent in 2023.
Real personal consumption expenditures (PCE) increased 1.2 percent. PCE services increased 4.0 percent, while spending on PCE goods decreased 0.8 percent.
- The increase in PCE services reflected widespread growth. The leading contributors to the increase in PCE were health care services and “other services,”1 which includes recreation services such as live entertainment.
- The leading contributor to the decrease in PCE goods was food and beverages, which decreased 6.2 percent. The decrease reflected an increase in the Puerto Rico consumer price index for food and beverage that outpaced the increase in current-dollar PCE.
- Net foreign travel, which equals foreign travel expenditures by Puerto Rico residents less expenditures in Puerto Rico by nonresidents, subtracted from PCE growth. Nonresident spending on PCE goods and PCE services in Puerto Rico increased.
Real government spending increased 4.8 percent. Spending increased across all levels of government, including widespread increases in investment spending by federal, central, and municipal governments. The increases in government investment spending reflect continued growth in disbursements of federal funds for disaster recovery activities associated with Hurricanes Irma and Maria in 2017, earthquakes in 2019 and 2020, and Hurricane Fiona in 2022. Notable ongoing projects include work to rebuild and improve the power grid, the aqueduct system, roads and bridges, and the National Guard’s Camp Santiago.
Real private fixed investment increased 3.8 percent, primarily reflecting widespread increases in equipment. The increase was led by industrial equipment, which includes purchases of engines, turbines, and electrical equipment by businesses.
Real private inventory investment decreased; the largest contributor to the decrease was the manufacturing sector.
Real imports increased 4.4 percent, primarily reflecting an increase in imports of goods. The increase was led by pharmaceuticals and organic chemicals, which increased 6.0 percent.
Real GDP for 2018–2022 was revised to incorporate updates to source data; the largest revision in any year was 0.4 percentage point in 2022. For more information, refer to “Technical Notes” below.
Because Puerto Rico is not included in most of the major surveys used by BEA to estimate U.S. GDP, the support and assistance provided by the government of Puerto Rico has been critical to the successful production of these estimates. BEA appreciates the information provided by numerous organizations and individuals in Puerto Rico including (in alphabetical order) the following:
- Discover Puerto Rico (Puerto Rico’s destination marketing organization)
- Economic Development Bank for Puerto Rico, Office of Economic Studies
- Office of the Commissioner of Insurance of Puerto Rico
- Puerto Rico Department of Economic Development and Commerce
- Puerto Rico Department of Labor and Human Resources
- Puerto Rico Department of Treasury
- Puerto Rico Electric Power Authority
- Puerto Rico Industrial Development Company
- Puerto Rico Institute of Statistics
- Puerto Rico Planning Board
- Puerto Rico Ports Authority
- Puerto Rico Tourism Company
Related Interactive Data Tables
For the annual GDP for Puerto Rico statistics highlighted in this release, as well as historical time series for these estimates, see the below data tables in BEA’s Interactive Data Application.
GDP
Table PRGDP1-1. GDP
Table PRGDP1-2. Real GDP
Table PRGDP1-3. Percent Change From Preceding Year in Real GDP
Table PRGDP1-4. Contributions to Percent Change in Real GDP
PCE
Table PRGDP2-1. PCE by Type
Table PRGDP2-2. Real PCE by Type
Table PRGDP2-3. Percent Change From Preceding Year in Real PCE by Type
Table PRGDP2-4. Contributions to Percent Change in Real PCE
Exports and imports of goods and services
Table PRGDP3-1. Exports and Imports of Goods and Services
Table PRGDP3-2. Real Exports and Imports of Goods and Services
Table PRGDP3-3. Percent Change From Preceding Year in Real Exports and in Real Imports of Goods and Services by Type of Product
Table PRGDP3-4. Contributions to Percent Change in Real Exports and Imports
Gross domestic investment
Table PRGDP4-1-1. Gross Domestic Investment
Table PRGDP4-1-2. Real Gross Domestic Investment
Table PRGDP4-1-3. Percent Change From Preceding Year in Real Gross Domestic Investment by Type
Private fixed investment
Table PRGDP4-2-1. Private Fixed Investment by Type
Table PRGDP4-2-2. Real Private Fixed Investment by Type
Table PRGDP4-2-3. Percent Change From Preceding Year in Real Private Fixed Investment by Type
Table PRGDP4-2-4. Contributions to Percent Change in Real Private Fixed Investment by Type
Sources of revisions to GDP for Puerto Rico
Estimates of GDP and its components for 2018–2022 that were released on July 31, 2024, have been revised to incorporate updates to source data including the following:
- Newly available financial data for companies from the Puerto Rico Department of State online Registry of Corporations and Entities and from the Puerto Rico Department of Economic Development and Commerce.
- Updated information from the Puerto Rico Planning Board for business inventories and sales, balance of payments, construction spending, and government spending.
- Newly available audited government financial statements and unaudited operating and budget statements for the Commonwealth government, its component units, and municipal governments.
- Updated data on shipments from the joint U.S. Census Bureau and BEA International Trade in Goods and Services (FT900) report.
The revised estimates exhibit a pattern of inflation-adjusted GDP growth similar to the previously published estimates.
| Puerto Rico: Revisions to Real GDP | |||||||||||
|---|---|---|---|---|---|---|---|---|---|---|---|
| Line | Current release | Revision from prior release | |||||||||
| 2018 | 2019 | 2020 | 2021 | 2022 | 2018 | 2019 | 2020 | 2021 | 2022 | ||
| Real GDP | |||||||||||
| 1 | Millions of chained (2012) dollars | 99,002 | 99,457 | 93,152 | 97,101 | 95,077 | 1 | 5 | 0 | 115 | 558 |
| 2 | Percent change from preceding period | —3.0 | 0.5 | —6.3 | 4.2 | —2.1 | 0.0 | 0.0 | 0.0 | 0.1 | 0.4 |
| Note. The revision from the prior release is calculated as the value reported in the current release minus the value reported in the prior release. GDP Gross domestic product U.S. Bureau of Economic Analysis | |||||||||||
For more information on the data sources underlying these estimates, see Summary of Methodologies: Puerto Rico Gross Domestic Product.
1“Other services” includes all services other than housing and utilities, health care, and food services and accommodations.