
News Release
Gross Domestic Product by County and Personal Income by County, 2024
Real gross domestic product (GDP) increased in 2,273 counties, decreased in 809 counties, and was unchanged in 24 counties in 2024, according to estimates released today by the U.S. Bureau of Economic Analysis. The percent change in real GDP ranged from a 76.6 percent increase in Carter County, MT, to a 46.3 percent decline in Baca County, CO.

The size of a county's economy as measured by real GDP varies considerably across the United States. In 2024, the total level of real GDP ranged from $813.7 billion in New York County, NY, to $15.7 million in Issaquena County, MS.
|
Large counties (population > 500,000) |
Medium counties (population 100,000 to 500,000) |
Small counties (population < 100,000) |
|
|---|---|---|---|
| Trends |
145 0 1 |
451 20 3 |
1,677 789 20 |
|
Trend range (percent change) |
10.7% (Pinal County, AZ) 0.0% (Johnson County, KS) |
12.4% (Jefferson County, TX) –2.6% (Black Hawk County, IA) |
76.6% (Carter County, MT) –46.3% (Baca County, CO) |
|
Size range (2017 chained dollars) |
$813.7 billion (New York County, NY) $12.7 billion (Pinal County, AZ) |
$46.6 billion (Mercer County, NJ) $2.6 billion (Liberty County, TX) |
$15.1 billion (Martin County, TX) $15.7 million (Issaquena County, MS) |
| Growth Decline No appreciable change | |||
| U.S. Bureau of Economic Analysis | |||
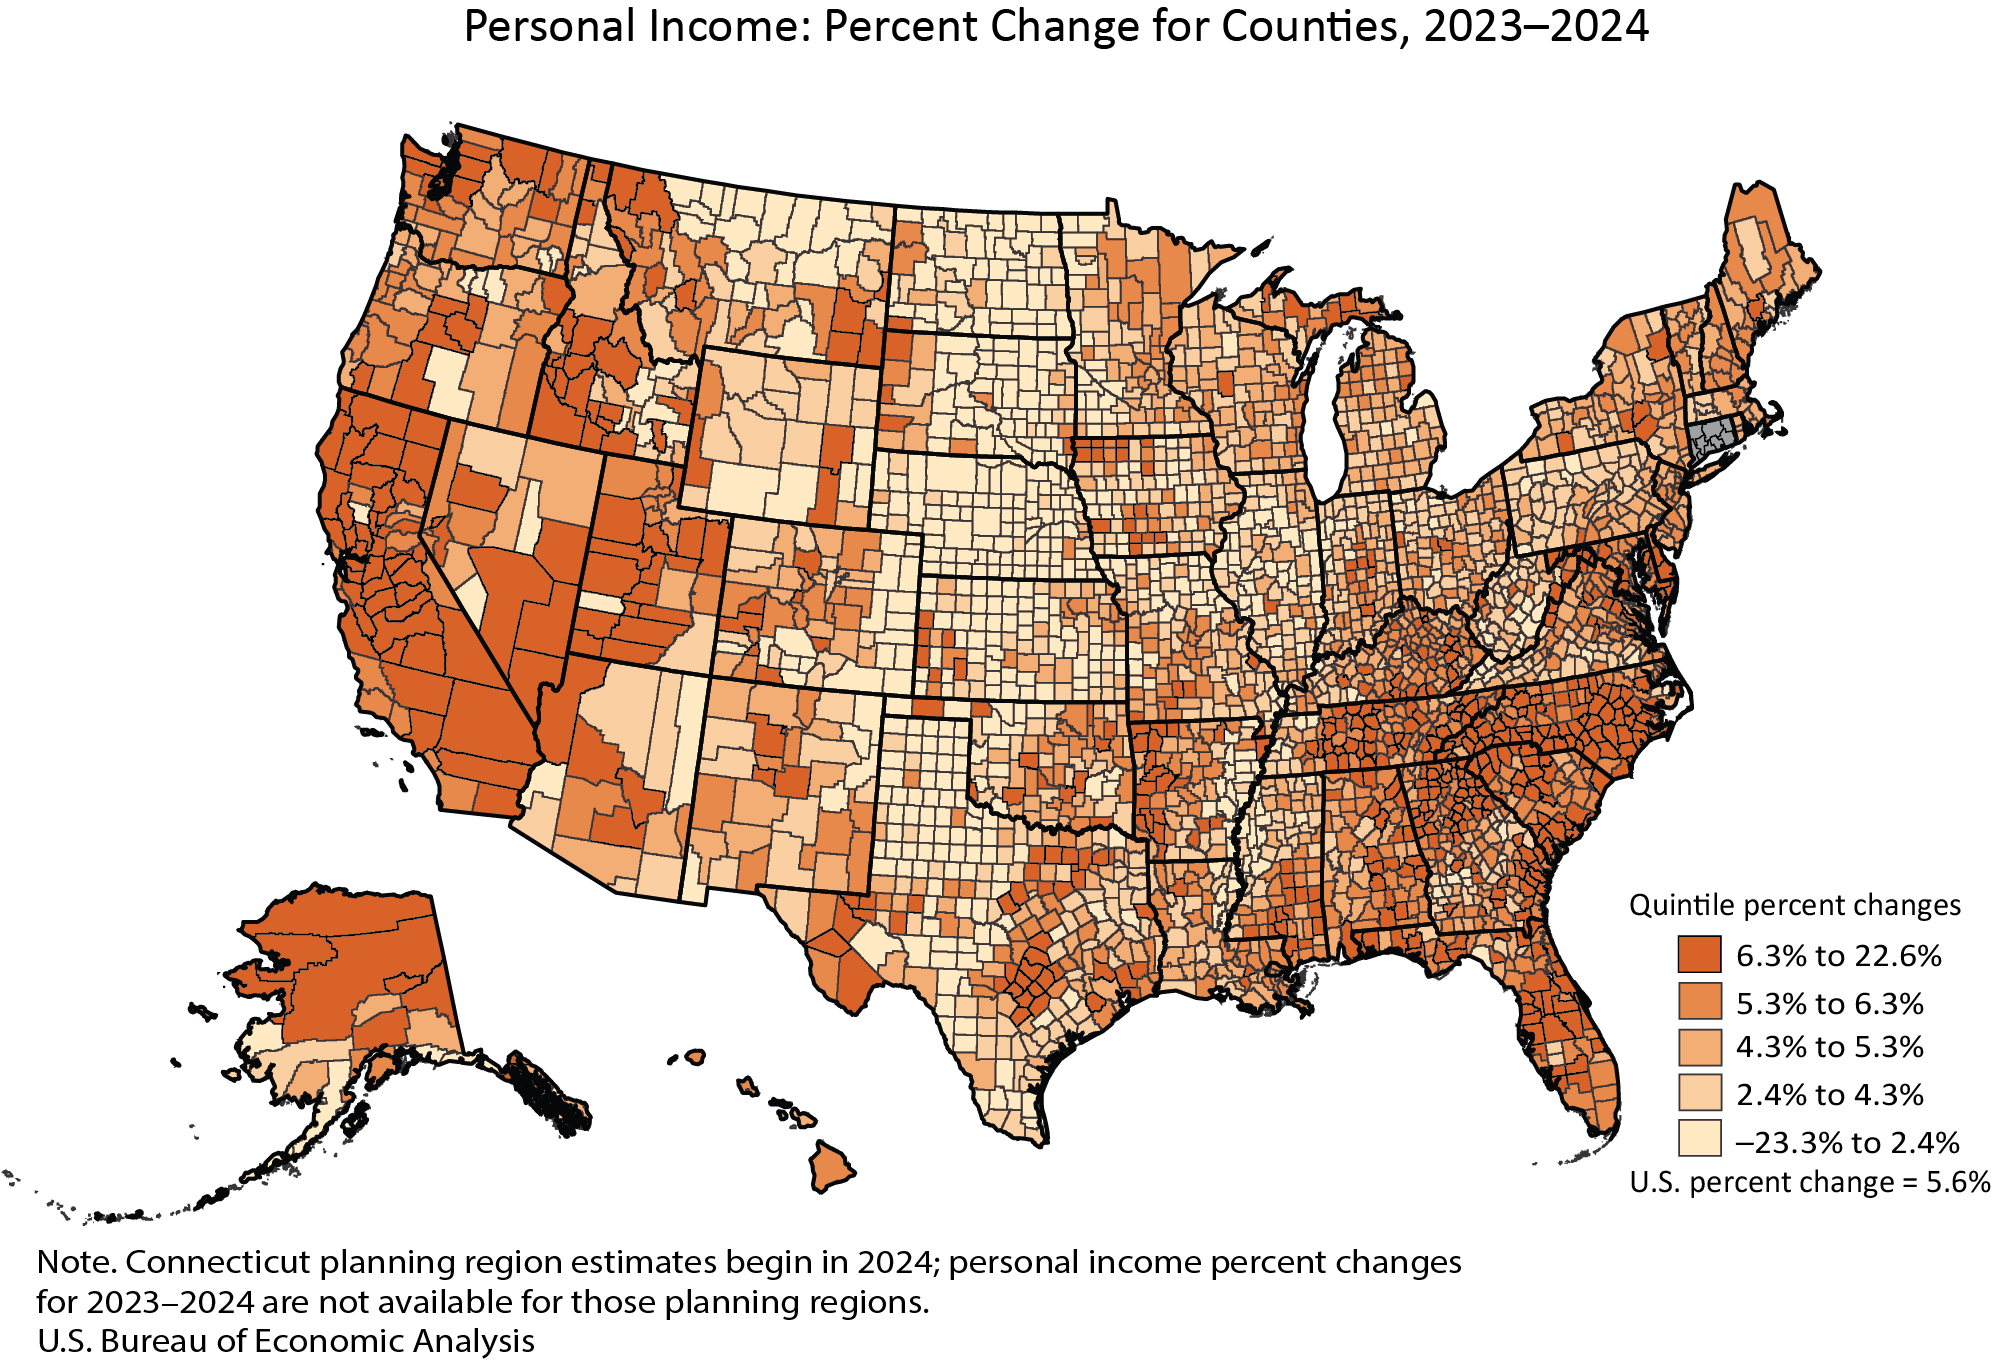
Personal income, in current dollars, increased in 2,768 counties, decreased in 331, and was unchanged in 7 counties in 2024. The percent change in personal income ranged from a 22.6 percent increase in Harding County, SD, to a 23.3 percent decline in Issaquena County, MS.
Personal income levels vary considerably across the United States. In 2024, the total level of personal income ranged from $818.5 billion in Los Angeles County, CA, to $10.6 million in Loving County, TX.
|
Large counties (population > 500,000) |
Medium counties (population 100,000 to 500,000) |
Small counties (population < 100,000) |
|
|---|---|---|---|
| Trends | 146 | 474 |
2,148 331 7 |
|
Trend range (percent change) |
9.7% (San Joaquin County, CA) 2.7% (Philadelphia County, PA) |
10.9% (Merced County, CA) 1.6% (Genesee County, MI) |
22.6% (Harding County, SD) –23.3% (Issaquena County, MS) |
|
Size range (current dollars) |
$818.5 billion (Los Angeles County, CA) $26.1 billion (Pinal County, AZ) |
$62.5 billion (Collier County, FL) $4.9 billion (Floyd County, GA) |
$12.4 billion (Teton County, WY) $10.6 million (Loving County, TX) |
| Growth Decline No appreciable change | |||
| U.S. Bureau of Economic Analysis | |||
Update of county statistics
The estimates for 2024 incorporate the results of BEA's annual updates of GDP and personal income by county that were released today. The annual estimates of GDP and personal income by county from 2020 to 2023 were revised. This update incorporates new and revised source data that are more complete than previously available and aligns county data with both the annual update to the National Income and Product Accounts released on September 25, 2025, and the annual update to personal income and GDP by state statistics released on September 26, 2025.
Beginning with BEA’s 2024 estimates of GDP and personal income, Connecticut estimates will incorporate the state’s planning region geographic definitions, replacing county geographic definitions. Because the estimates for planning regions are only available for 2024, they are not included in the percent change ranges in the news release.
BEA released new estimates of per capita personal income for 2024. BEA used U.S. Census Bureau population figures to calculate per capita personal income estimates for 2020 through 2024.
New combined county news release
BEA published annual GDP and personal income by county in a single news release today for the first time. This combined release provides a fuller picture of the economies of all counties and replaces the publication of two separate releases issued on different days.
Discontinuation of statistics for metropolitan areas
With the release of GDP and personal income statistics for counties for 2024, BEA has discontinued publication of statistics for metropolitan statistical areas, micropolitan statistical areas, metropolitan divisions, combined statistical areas, and metropolitan and nonmetropolitan portions. GDP and personal income estimates will continue to be published by county. For more information, see the FAQ.
Recent changes in the presentation of tables
Data previously published as tables within the county news releases of GDP and personal income are updated and available simultaneously with today’s release in BEA’s online Interactive Data Application. However, tables are no longer included within the news release. This reduces duplication, increases efficiency, and points data users directly to BEA’s most complete and flexible data tables, via links in the release. These customizable tables include full time series and can be downloaded as PDFs, in Excel, or in CSV format.
Related Interactive Data Tables
For the 2024 GDP and personal income by county statistics highlighted in this release, as well as historical time series for these estimates, see the below data tables in BEA’s Interactive Data Application.
GDP by county
Table CAGDP1. County GDP Summary (Percent Change From Preceding Period)
Table CAGDP1. County GDP Summary (Thousands of Chained 2017 Dollars)
Personal income by county
Table CAINC1. County Personal Income Summary (Percent Change From Preceding Period)
Table CAINC1. County Personal Income Summary (Thousands of Dollars)
Note. With the release of 2025 GDP and personal income by county statistics on December 2, 2026, the 2024 data will be superseded, and the links above will reflect the latest data. The original data featured in this release can then be accessed in BEA’s Data Archive.
Next release: December 2, 2026, at 8:30 a.m. EST
GDP by County and Personal Income by County, 2025