BEA Director Steve Landefeld
Imagine you’re trying to find your way through a thick forest. It’s a difficult task. You have nothing to help you navigate—no compass, no GPS, and no communications device to use to contact someone for help. In fact, in your wandering, you’ve lost your bearings so completely that you’re not even sure where you’ve been, let alone where you’re going.

Now imagine you’ve been given an overhead view of the forest that shows you where you currently are, where you’ve traveled, and which direction you should head. In essence, that’s what the U.S. Bureau of Economic Analysis (BEA) does for everyone trying to figure out what course to steer through the U.S. economy. The economic statistics produced by the Bureau allow policymakers, businesses, and households to see where the economy has been and where it might be headed, so all can make better informed decisions on what course of action they should take.
Beginning today, we will feature some of these statistics and give you some insight into what they mean. Welcome to the first of BEA’s blog posts. We hope readers will find these posts a reliable source of easy-to-understand information about the U.S. economy. We also hope readers will gain interesting perspectives from some of the statistics that will be featured.
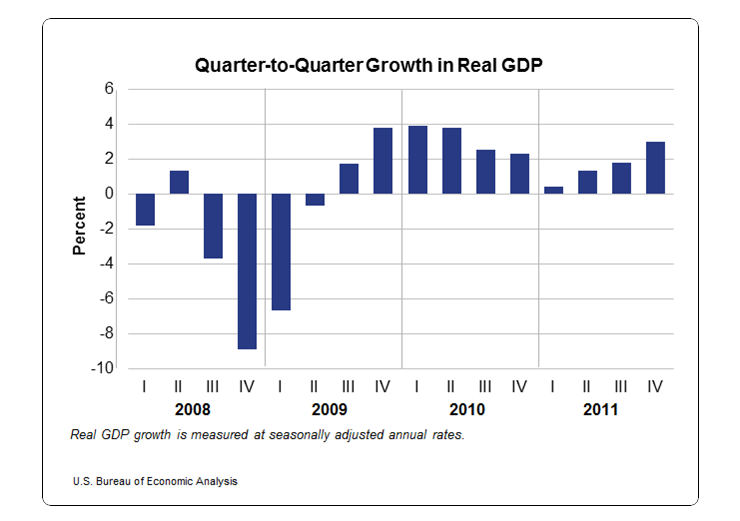
Probably the most followed number that BEA produces is gross domestic product (GDP). GDP is the value of all goods and services produced in the United States. Its development began in the mid-1930s when our elected leaders were trying to figure out how to guide the nation out of the depths of the Great Depression. Their efforts were seriously hampered because they simply did not know what was going on in the economy. The absence of reliable data about the economy made it difficult to develop an action plan. It was like being lost in a forest.
So a predecessor agency to BEA in the Commerce Department enlisted economist Simon Kuznets (who would eventually win a Nobel Prize for his efforts) to develop the first set of national economic accounts, which were presented in a report to Congress in 1934. By 1942, the first annual estimates of gross national product were introduced to complement the national income data and facilitate planning for World War II.
In their textbook on economics, Paul Samuelson and William Nordhaus noted that “while the GDP and the rest of the national income accounts may seem to be arcane concepts, they are truly among the great inventions of the twentieth century.”
Today, GDP and the national accounts have become a mainstay for economic analysis. In 2000, GDP was recognized as one of the great inventions of the 20th century. By providing a steady stream of useful economic data, the GDP accounts have played a significant role in the country’s economic well-being.
“Much like a satellite in space can survey the weather across an entire continent, so can the GDP give an overall picture of the state of the economy,” Samuelson and Nordhaus observed in their textbook. “It enables the President, Congress, and the Federal Reserve to judge whether the economy is contracting or expanding, whether the economy needs a boost or should be reined in a bit, and whether a severe recession or inflation threatens.”
Of course the economy has changed quite a bit in the last 75 years, and the GDP accounts have changed along with it. New innovations and methodologies have continually been incorporated to make the accounts as accurate and relevant today as they have been since their creation.