
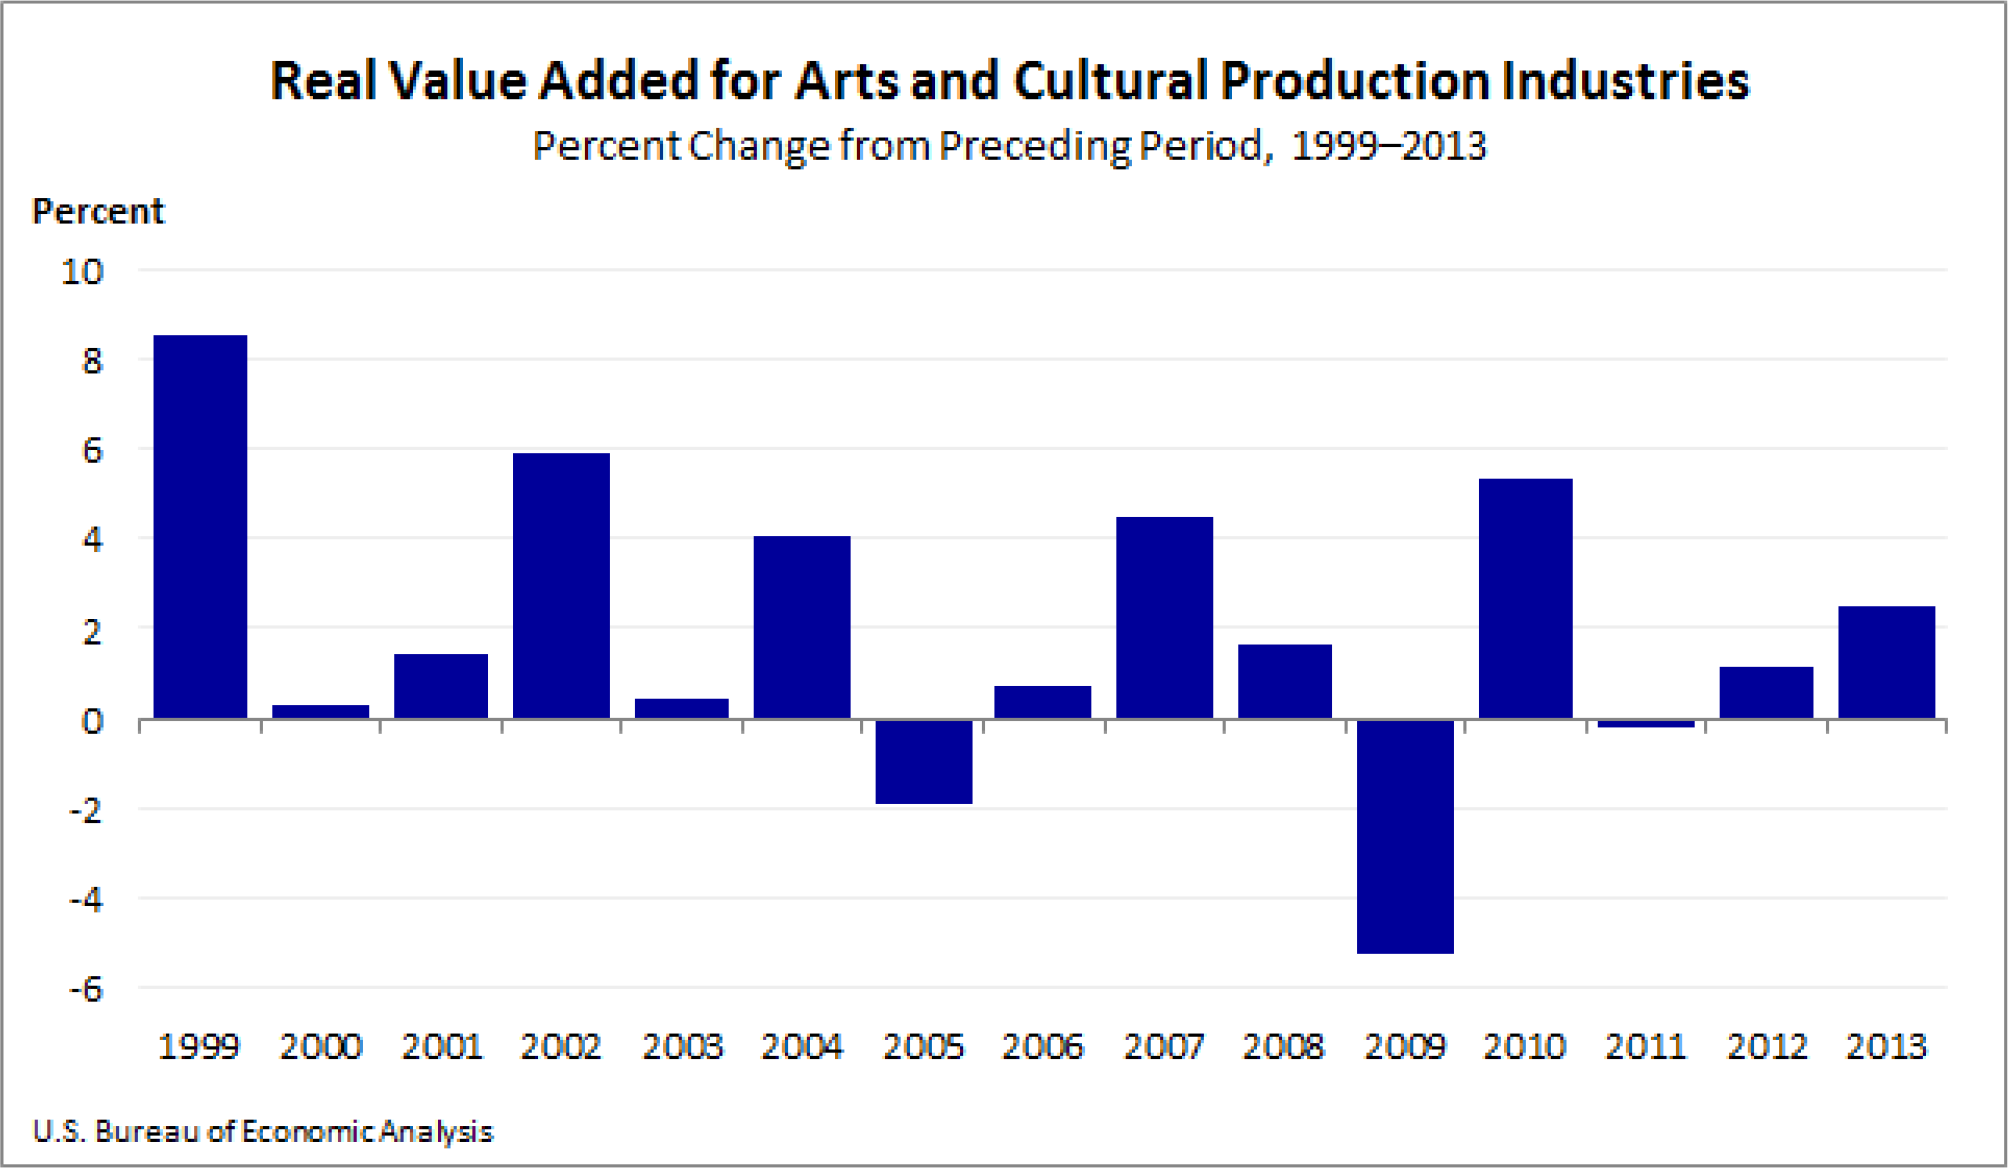
Arts and cultural economic activity, adjusted for inflation, grew 2.5 percent in 2013, according to estimates of the industries’ real value added by the Bureau of Economic Analysis. That compares with a 1.1 percent increase in 2012.
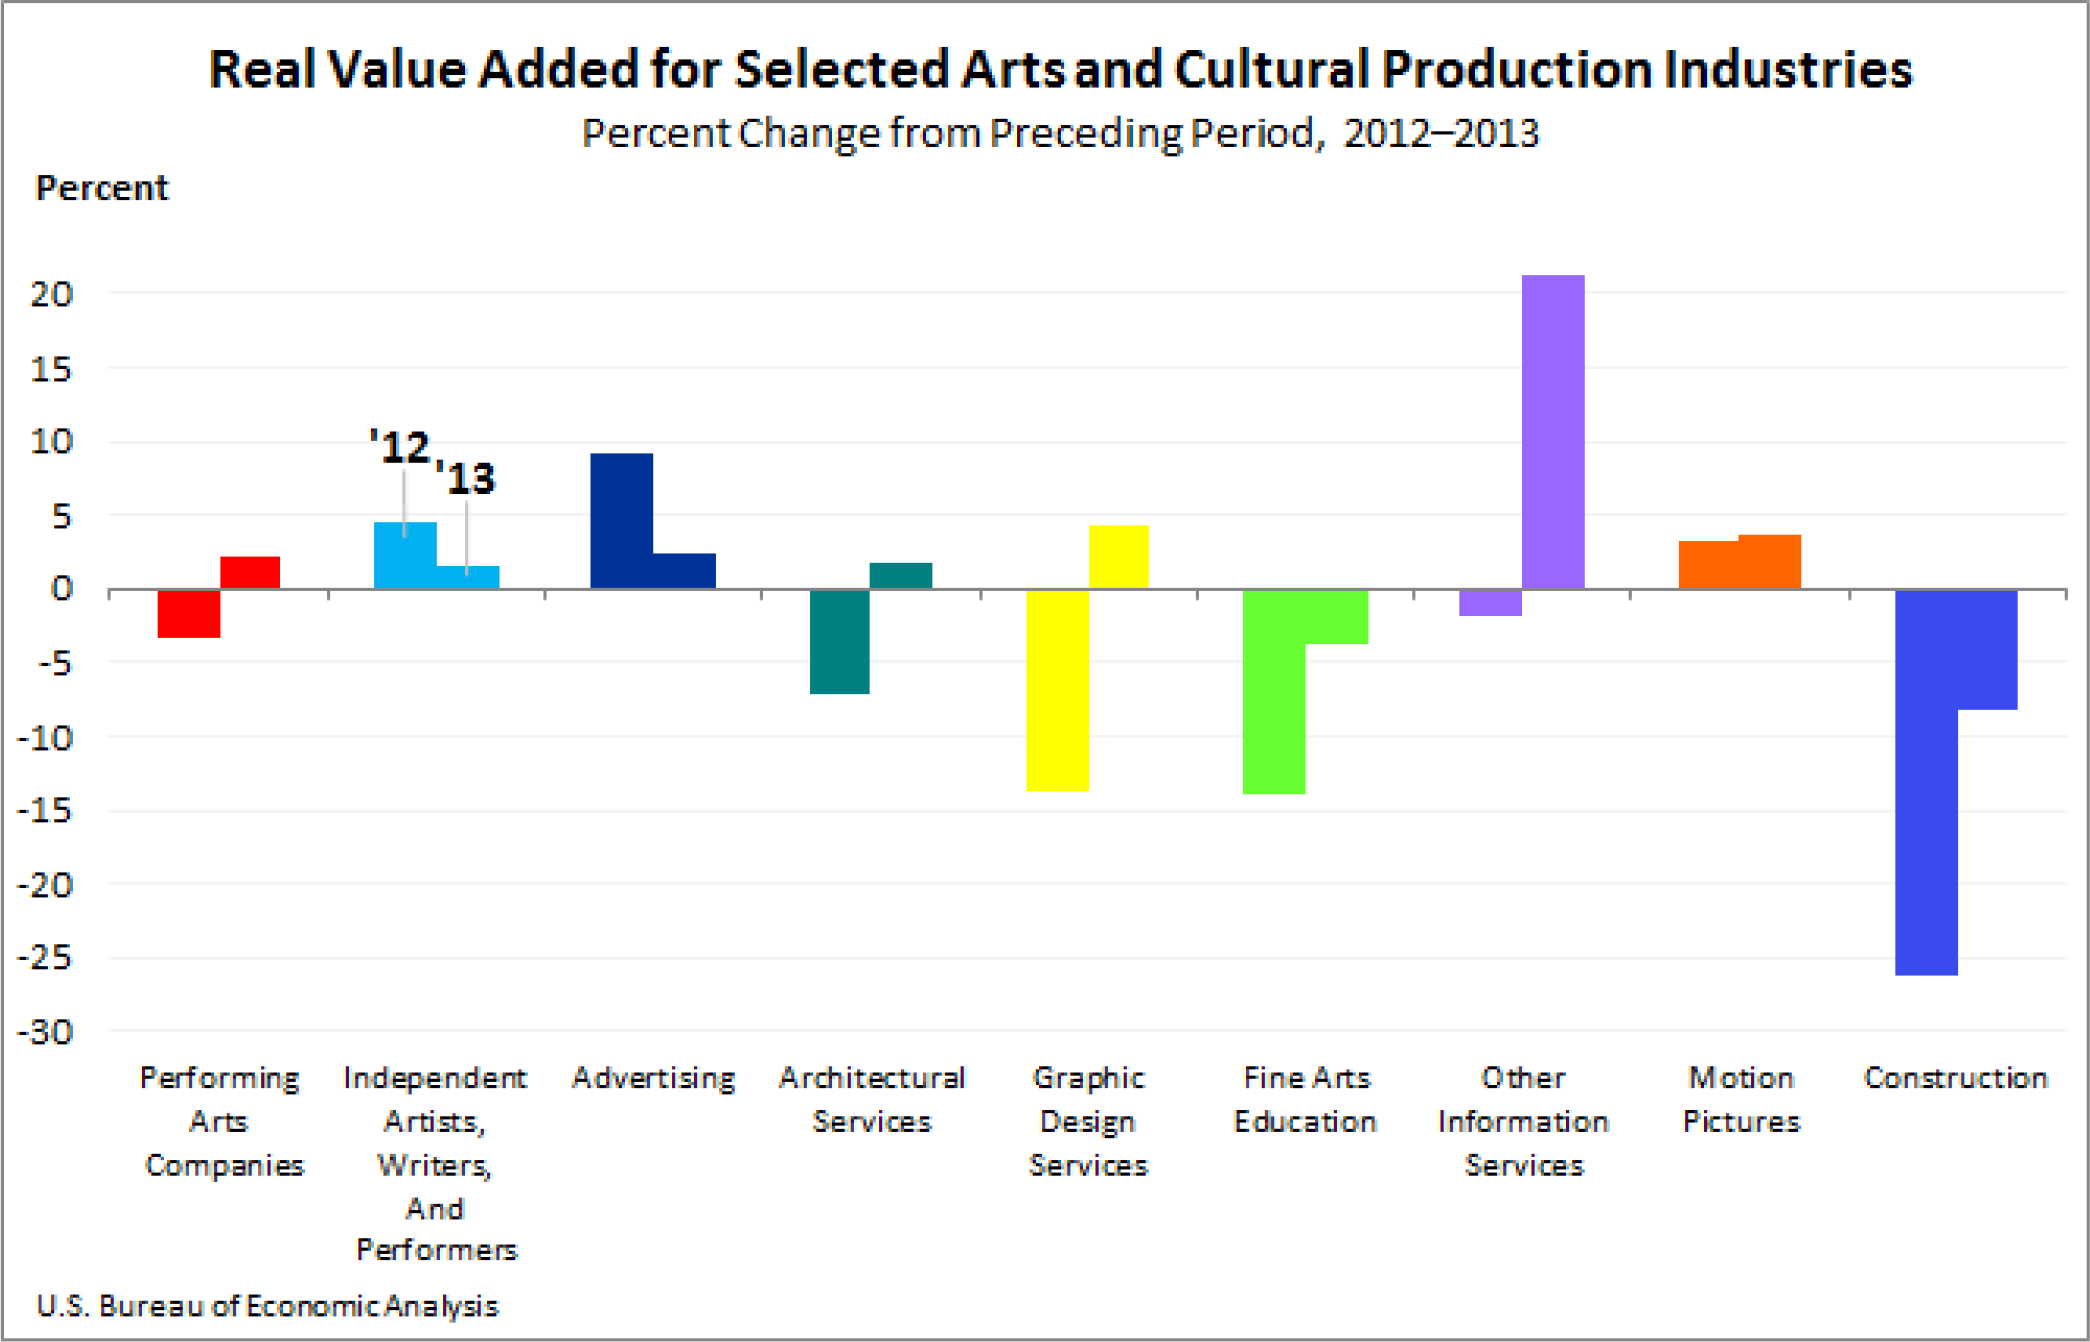
Information services and design services were the leading contributors to the growth in 2013. Overall, 26 of 36 arts and culture-related industries contributed to the increase. As a group, the core arts and cultural industries, such as performing arts, museums and design services, grew 3.3 percent.
This is the first time that BEA has released inflation-adjusted statistics that track the changing economic impact of arts and culture.
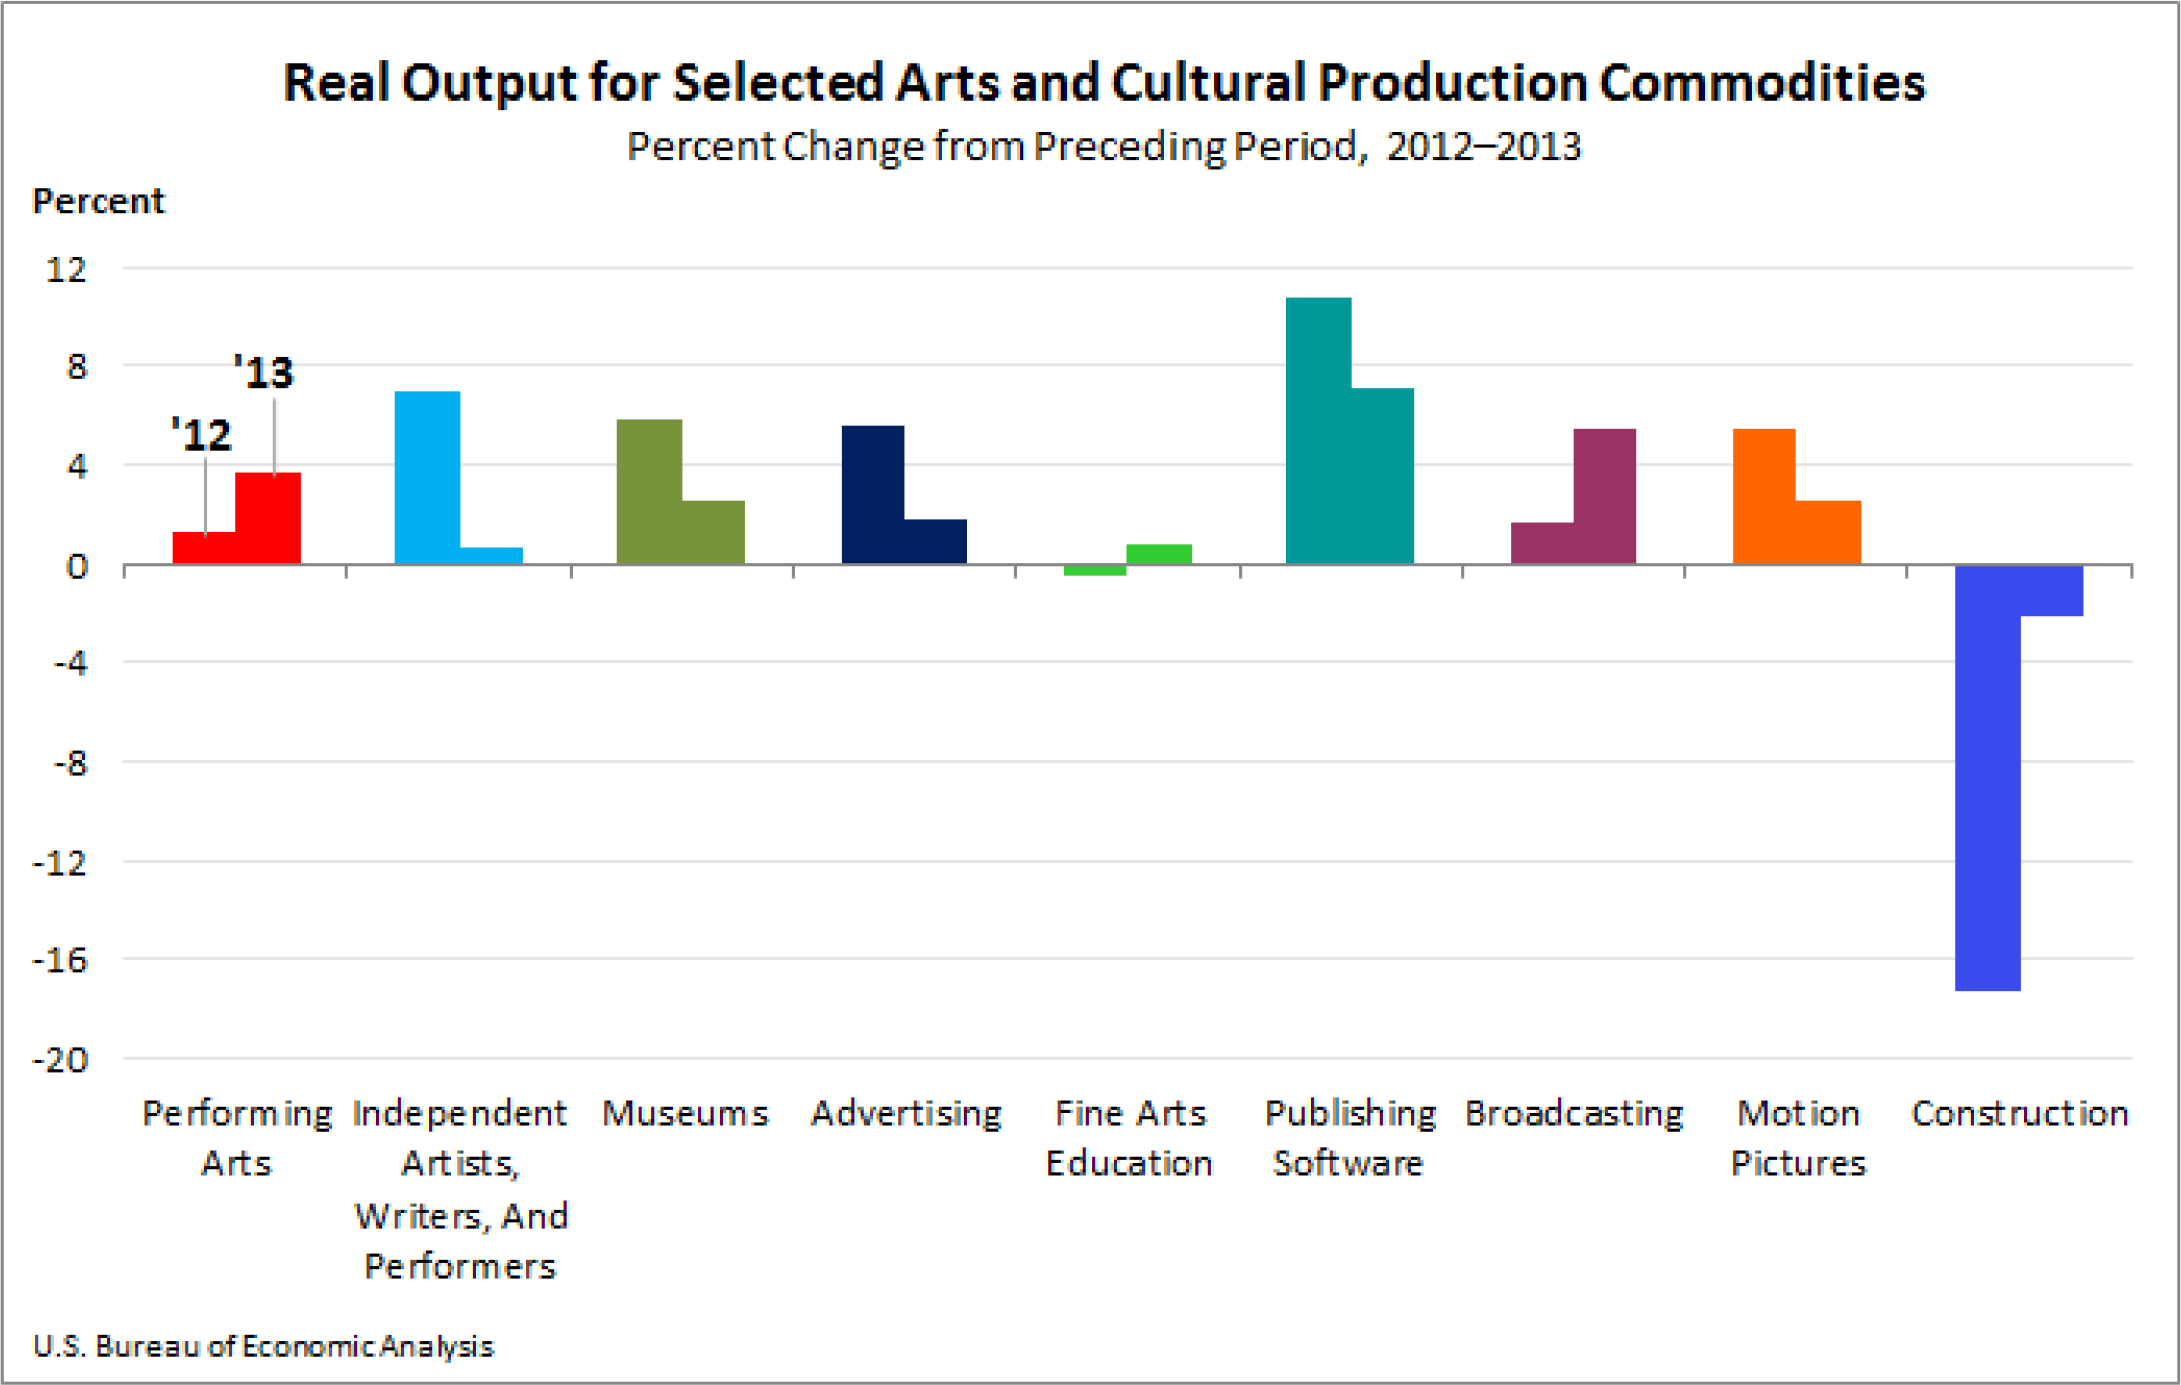
In addition to the real value added statistics, BEA’s Arts and Cultural Production Satellite Account also includes a measure of real gross output. Under that measure, total inflation-adjusted spending on all arts and cultural commodities reached $1.1 trillion in 2013. That figure was up 2.7 percent from the year before. Still, real gross output growth slowed slightly from 2012, when it had increased 2.8 percent.
In contrast to the value added statistics, gross output is not adjusted to exclude expenses incurred in the production process. For example, gross output for the opera reflects all ticket receipts without subtracting the expenses incurred in the production of the opera, such as advertising, rent and costume rentals.
Lovers of the performing arts take note: Their gross output grew at a faster pace in 2013, increasing 3.7 percent, up from 1.2 percent the year before. This faster growth was widespread, including gains in music, opera and theater.
Employment for all arts and cultural industries totaled 4.74 million in 2013. Art support services, including rental and leasing, totaled 1.19 million jobs, the most in all arts and cultural industries. Information services, including publishing, motion pictures and broadcasting, accounted for 1.17 million jobs. Retailers related to arts and culture totaled 731,200 jobs.
Culture can be defined in a variety of ways. For this account, arts and cultural production is defined narrowly to include creative artistic activity; the goods and services produced by it; the goods and services produced in the support of it; and the construction of buildings in which it is taking place.
For more information, read the full report.