
Sure, Broadway and Hollywood employ lots of creative people. But when it comes to artistic and cultural work, not all the action is on the coasts. New data show arts and culture account for a larger share of jobs in Wyoming, Utah and Colorado than they do nationally.
For the first time, the Bureau of Economic Analysis has produced statistics spotlighting the economic impact of arts and cultural activities in each state and the District of Columbia.
These state-level employment and compensation estimates add local detail to the more expansive national data in the Arts and Cultural Production Satellite Account, a set of experimental statistics first released in 2013. The state data cover the years 2001-2014. National data have been updated with estimates for 2014.
Arts and cultural economic activity accounted for 4.2 percent of the nation’s gross domestic product, or $729.6 billion, in 2014. Arts and culture, including supporting industries, accounted for 4.8 million wage and salary jobs across the nation.
One way to see the states where these jobs have a relatively larger presence is by using BEA’s employment location quotients. These measurements compare the share of arts and cultural jobs within a state’s total employment with the share of arts and cultural jobs nationally.
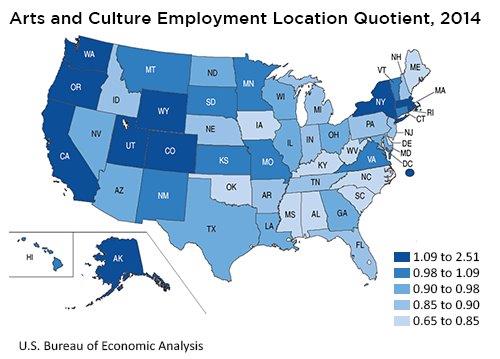
For example, Wyoming’s location quotient is 1.30, meaning its share of arts and cultural employment relative to other jobs in the state was 30 percent above the national average, and ranks second-highest among the states. Many of these jobs fall into the “government” category, including arts- and culture-related work within American Indian tribal councils and Wyoming’s expansive parklands. Other Western states, including Utah and Colorado, show a similar pattern.
Washington state’s employment was boosted by retail work in online sales of arts- and culture-related books and merchandise.
As expected, motion pictures starred in California’s arts and culture employment. Government, retail and media jobs figured strongly in New York, in addition to the performing arts.
The District of Columbia was also measured, and it had the highest location quotient – 2.51. That reflects the high number of government employees in the federal city, many with work related to arts and culture, such as at Smithsonian museums, the Kennedy Center and national monuments.
The states with the highest concentration of arts and cultural jobs, with their location quotients: New York (1.47), Wyoming (1.30), Washington (1.28), California and Utah (both 1.17), Rhode Island and Colorado (1.13), Alaska (1.11), Massachusetts and Oregon (both 1.09).
You can find handy one-page highlights for each state, or access more detailed state and national data, on bea.gov. See BEA’s news release for more information about the arts and cultural account.
The account offers statistics for “core” arts and cultural activities and for their “supporting” industries.
The core industries are originators of ideas and content associated with arts and culture, such as performers, writers, artists and designers; museums, historical sites and nature parks; and managers, agents and promoters.
The supporting industries produce and disseminate arts and cultural commodities. They include broadcasters, art galleries, grant-makers, and governments of all levels. In some cases, such as companies making musical instruments, most of their workers fall under this account. But for many supporting industries – such as retail, construction and printing – the jobs in the arts and cultural account represent a small percentage of the industry’s total employees.
An example: Dancers are core arts employees. Workers who make ballet slippers, build theaters or print programs are in supporting industries.
Satellite accounts are built by painstakingly identifying data spread throughout BEA’s existing national economic accounts, and also weighing outside information that may shed more light on the subject. These accounts don’t change official U.S. statistics, such as gross domestic product. But they do produce more in-depth analysis of their subjects, which is valuable to businesses, analysts, policymakers and other Americans.
Deciding what to include and what to exclude can be an art in itself. BEA’s definition of arts and cultural economic activity is largely consistent with those of the United Nations and the European Union. Unlike some of our international counterparts, BEA excludes sports.
BEA continues to seek more detailed data for its satellite accounts and to refine their methodology. Comments and suggestions are welcome at artsandculture@bea.gov.
This satellite account was created with the support of funding from the National Endowment for the Arts.