
Detailed statistics on U.S. direct investment abroad – or “outward direct investment”– and on foreign direct investment in the United States – or “inward direct investment” – are now available on BEA’s website.
Preliminary statistics for 2016 and updated statistics for 2014 and 2015 are now included in the Bureau of Economic Analysis’ data tool, International Trade and Investment Country Facts, as well as in BEA’s interactive data tables.
These newly released statistics include:
- Positions, financial transactions, and income for all countries and for all industries
- More detailed data for selected countries by major industry
- Reinvestment ratios and rates of return
- For outward direct investment, positions and income by the industry of the U.S. parent
- For inward direct investment, positions and income by country of the ultimate beneficial owner
BEA will publish all of this information in a Survey of Current Business article in September 2017.
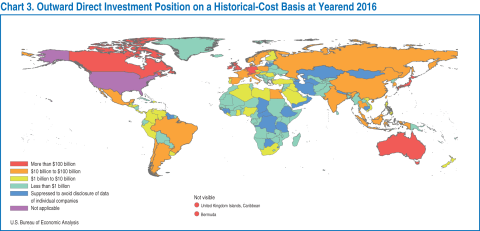
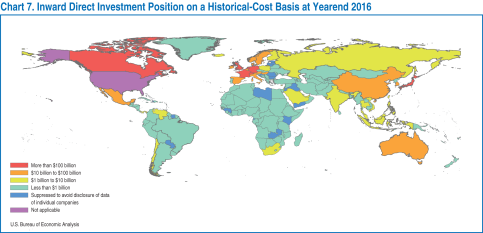
These newly released statistics provide vital information to answer questions such as: Where do U.S. companies invest abroad? Which countries invest in the United States? And what industries attract the most direct investment?
The map below shows the level of direct investment by U.S. multinationals in foreign countries. This series is based on the country of the immediate investment, or the first step in the ownership chain outside of the United States.
The next map shows the level of foreign direct investment in the United States by foreign multinationals. This series is based on the country of immediate investor, or the first step in the ownership chain outside of the United States. Information on the ultimate owner is also available in BEA’s interactive data tables.
The maps shown above can be found in the July 2017 Survey of Current Business article summarizing the 2016 direct investment positions.