
The Bureau of Economic Analysis released a new set of statistics detailing how much the United States spends to treat different diseases and medical conditions.
The statistics, part of BEA’s Health Care Satellite Account created in 2015, offer a new way of looking at health care spending. They break out spending by the treatment of disease, such as circulatory diseases or cancers, rather than by place of service, such as hospital or doctor’s office. The newly released statistics update previous estimates and cover the year 2014.
Here are some findings:
- Total spending to treat diseases and medical conditions accelerated in 2014 from 2013, in part reflecting expanded insurance coverage stemming from the Affordable Care Act. Spending grew by $112 billion, or 5.8 percent, to just over $2 trillion. For comparison, total spending grew by 2.6 percent in 2013. And, it grew by an average of 4.2 percent annually over the previous five-year period (2008-2013).
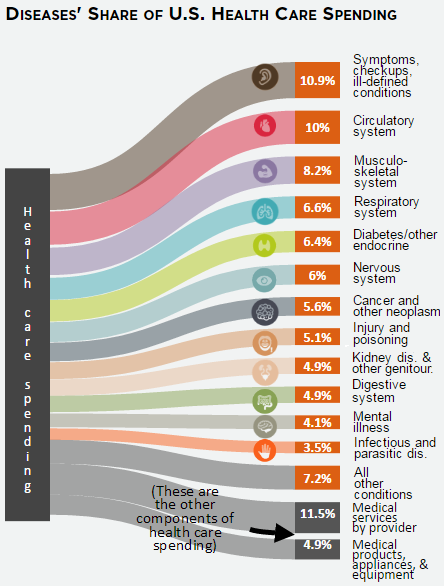
- Health care spending accounted for more than 20 percent of all spending by consumers in the United States. The top three spending categories by disease in 2014 were the same as the prior year: 1) symptoms, including check-ups and some preventative services, which accounted for 10.9 percent of total health care spending in 2014; 2) circulatory (10 percent); and 3) musculoskeletal (8.2 percent).
- Spending to treat endocrine conditions, such as diabetes and high cholesterol, saw the largest over-the-year increase of $15.6 billion in 2014. The second-largest spending increase of $14 billion came from treating infectious and parasitic diseases.
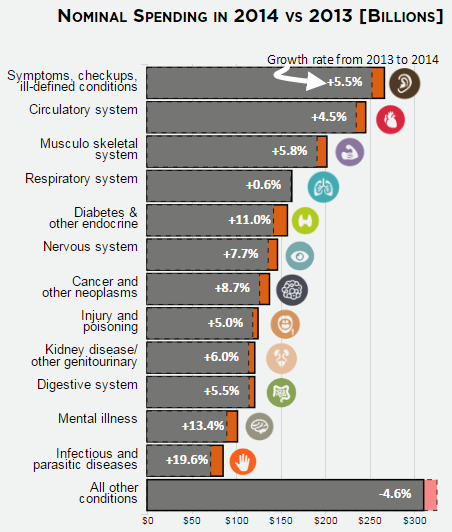
- Health care spending increases for two primary reasons: more individuals are receiving treatment or there is an increase in the average expenditure to treat patient conditions (i.e., the price of treatment). The latest health care statistics show that an increase in the price of treatment contributed to the faster growth in total health care spending in 2014. The price of treatment grew by 3.3 percent from 2013, 0.8 percent faster on average than the prior five-year period.
- The price of treating infectious disease conditions, such as HIV and hepatitis, grew the fastest at 15.7 percent. That compares to 11.7 percent growth on average in the price to treat infectious diseases over the previous five-year period.
- The price of treating pregnancy, decreased by 2.5 percent in 2014. That was 7 percent lower than the previous five-year average rate.
The statistics cited in this blog come from BEA’s “Blended Account,” which combines data from multiple sources, including large claims databases, covering millions of enrollees and billions of claims. The newly released statistics, along with information about BEA’s Health Care Satellite Account, are available on our public website.
The Health Care Satellite Account provides an alternative view of the health care sector that may lead to a better understanding of health care spending trends and policies, such as the Affordable Care Act. Researchers should keep in mind that many factors may be involved in spending changes, such as demographic factors, treatment practices, and changing technologies. Careful analysis is necessary to attribute spending changes to different causes. A future blog post will look at the macroeconomic aspects of the new estimates.