The personal saving rate, technically described by BEA as “personal saving as a percentage of disposable personal income,” is the percentage households save of their after-tax income. For 2016, the rate was 4.9 percent. The saving rate is published monthly, quarterly, and annually with BEA’s Gross Domestic Product and Personal Income and Outlays statistics. Personal saving statistics are used by businesses, the White House and Congress, the Federal Reserve, and Wall Street to prepare, plan, and project budget estimates, monetary estimates, financial strategies, and more.
How is it calculated?
To calculate the personal saving rate, BEA starts with personal income, and subtracts from that personal taxes to derive “disposable personal income.”
Then, personal outlays are subtracted from disposable personal income—this results in an estimate of “personal saving.”
The saving rate is personal saving divided by disposable personal income.
How often is it updated?
BEA updates the personal saving rate on a regular schedule to incorporate new and revised source data, improved estimation methods, and changes in definitions and concepts, all of which improve the accuracy and relevance of the savings rate.
Initial quarterly estimates are first published as part of the “advance” quarterly GDP release approximately one month after the end of a quarter; these estimates are revised during the subsequent “second” and “third” quarterly releases.
In addition, as part of the “second” quarterly GDP release, BEA updates the previous quarter’s estimates of personal income, disposable personal income, personal saving, and the personal saving rate to incorporate newly available preliminary tabulations from the Bureau of Labor Statistics’ Quarterly Census of Employment and Wages. BEA also conducts annual updates each July and comprehensive updates about every five years to incorporate newly available source data and implement any major methodological improvements.
Do the updates change the trend in personal saving?
No. Despite revised estimates of the personal saving rate over these update cycles, long-term trends in the personal saving rate over the past 45 years have not changed. As the chart below shows, successive comprehensive updates (CUs) have generally resulted in upward revisions to the level of the personal saving rate, but the rate has consistently shown a downward trend through the mid-2000s, coinciding with the housing boom, and a moderating upward trend since 2008, the height of the financial crisis.
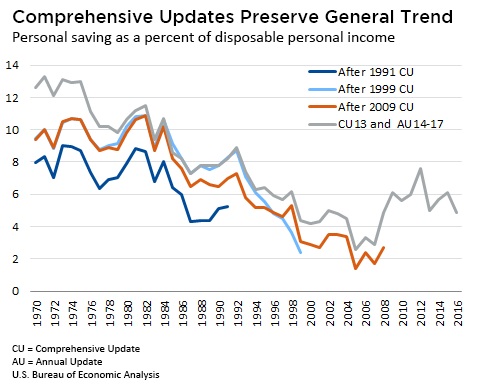
Over the decades, revisions to the personal saving rate have reflected many improvements to estimation methods. They include the treatment of government employee retirement plans (1999 CU), revised estimates of misreported income (2009 CU), new information on employee “cafeteria” benefit plans (2009 CU), and the adoption of accrual-based accounting methods for defined benefit pension plans (2013 CU).
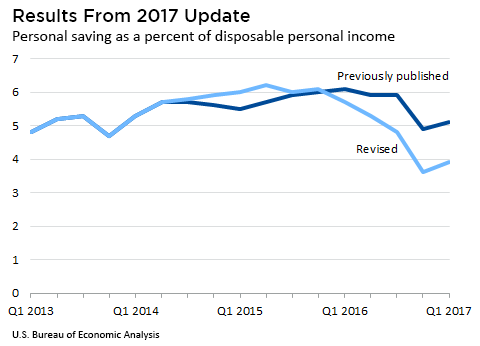
BEA revised the personal saving rate as part of its annual update last month. As a result, the saving rate is now slightly higher for 2015 and lower for 2016 than previously estimated (See chart below). The lower saving rate reported for 2016 reflected a larger amount of personal outlays, notably consumer spending, and a smaller amount of personal income, than previously published. New data from the Bureau of the Census, the Bureau of Labor Statistics, the Internal Revenue Service, and the Federal Reserve were the primary reasons for recent changes in the saving rates.