
December 28, 2017
The U.S. net international investment position increased to −$7,768.7 billion (preliminary) at the end of the third quarter from −$8,004.1 billion (revised) at the end of the second quarter. The $235.4 billion increase reflected net financial transactions of –$87.4 billion and net other changes in position, such as price and exchange-rate changes, of $322.8 billion.
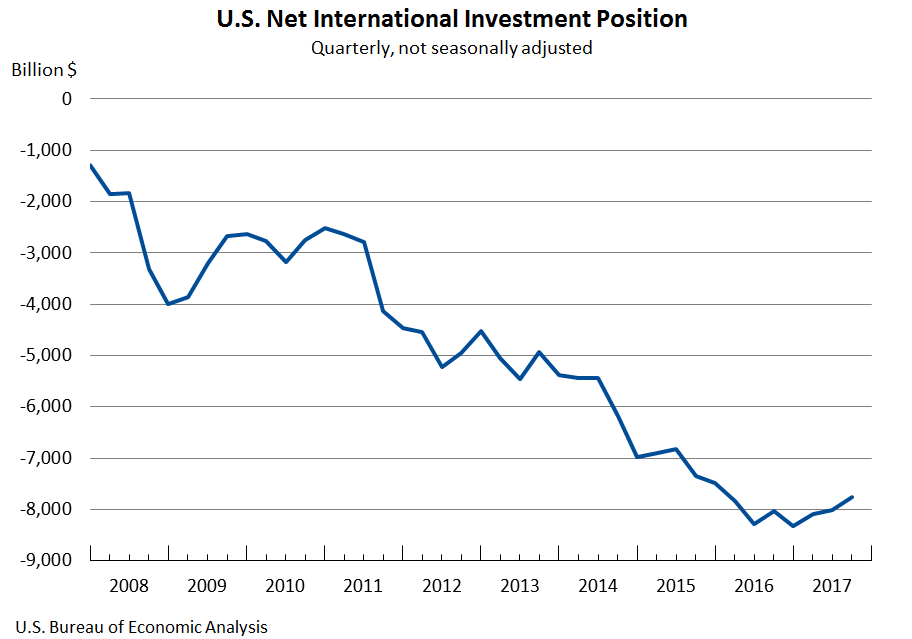
- The net investment position increased 2.9 percent in the third quarter, compared with an increase of 1.1 percent in the second quarter, and an average quarterly decrease of 5.3 percent from the first quarter of 2011 through the first quarter of 2017.
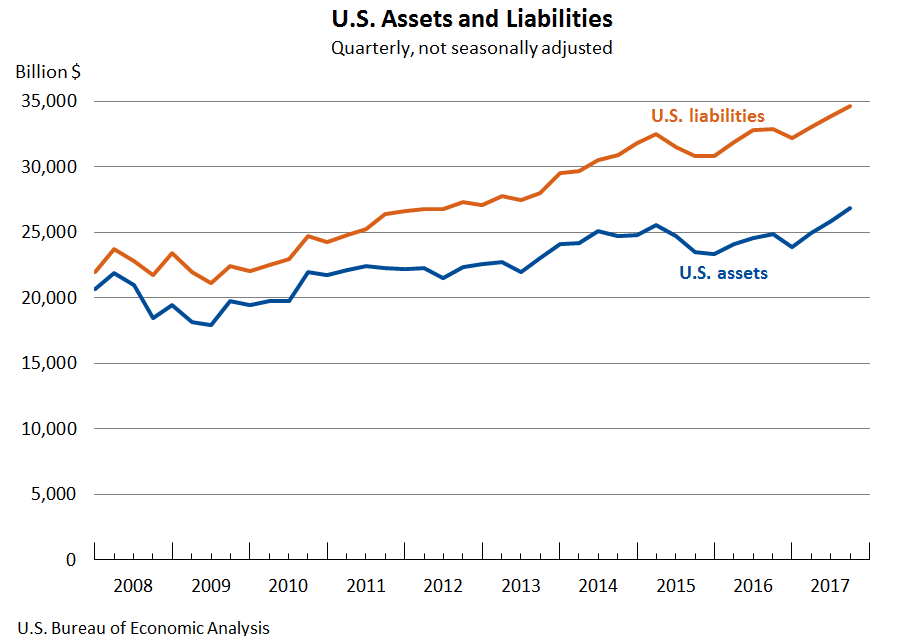
- U.S. assets increased $1,001.2 billion to $26,854.9 billion, mostly reflecting increases in portfolio investment and direct investment assets due to increases in foreign equity prices, appreciation of major foreign currencies against the U.S. dollar, and financial transactions.
- U.S. liabilities increased $765.8 billion to $34,623.6 billion, mostly reflecting increases in portfolio investment and direct investment liabilities due to increases in U.S. equity prices and financial transactions.
For more information, read the full report.