
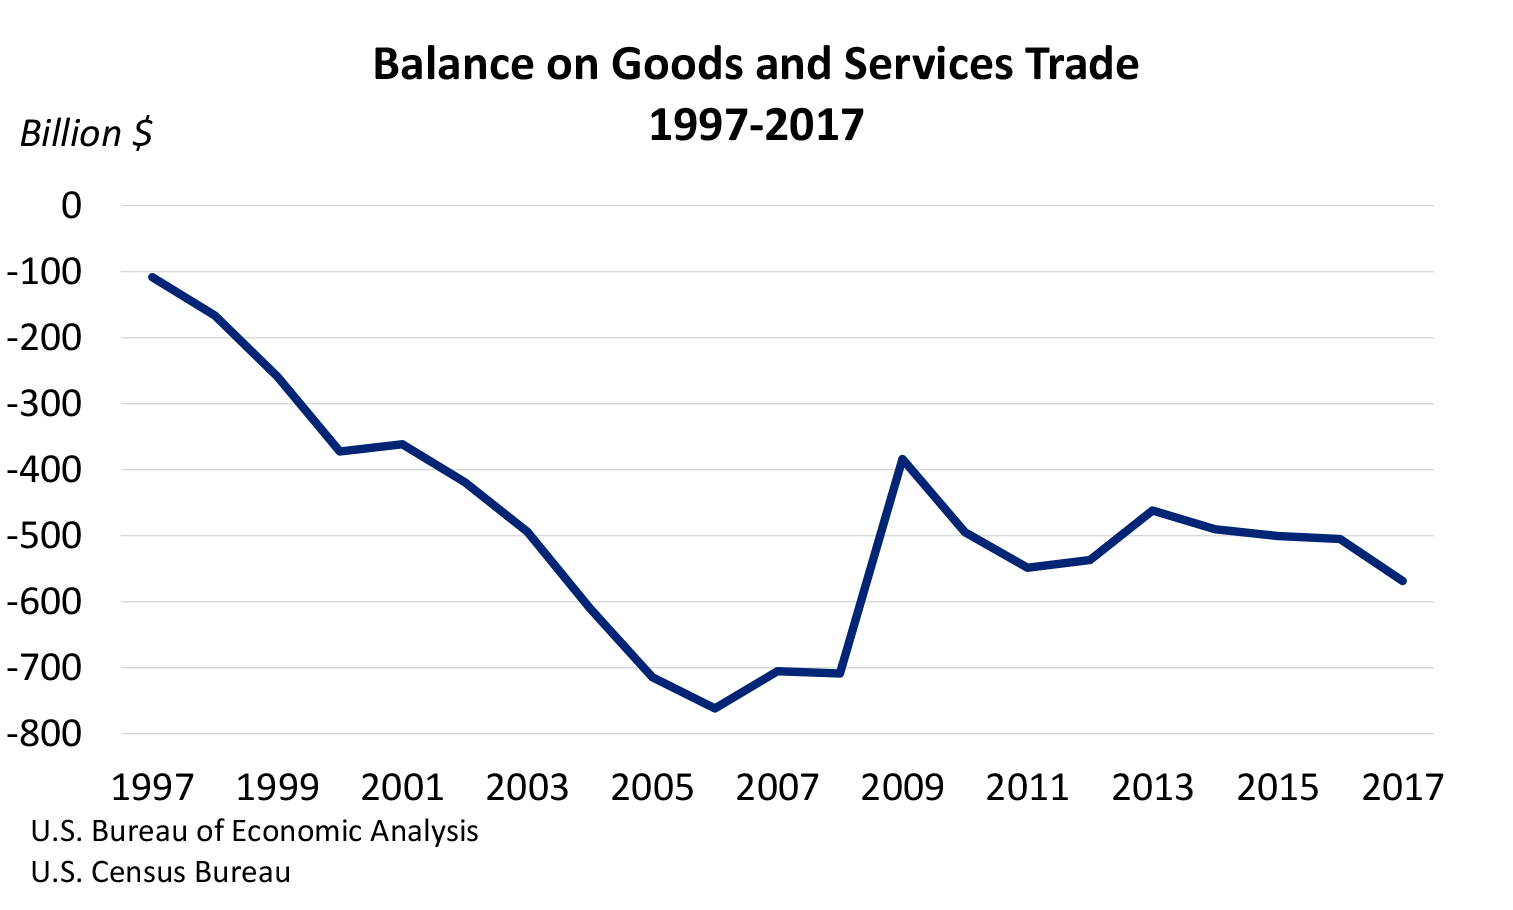
The U.S. international trade deficit increased in 2017 according to the U.S. Bureau of Economic Analysis and the U.S. Census Bureau. The deficit increased from $504.8 billion in 2016 to $568.4 billion in 2017, as imports increased more than exports. As a percentage of U.S. gross domestic product, the goods and services deficit was 2.9 percent in 2017, up from 2.7 percent in 2016. The goods deficit increased from $752.5 billion in 2016 to $811.2 billion in 2017, and the services surplus decreased from $247.7 billion in 2016 to $242.8 billion in 2017.
Exports
Exports of goods and services increased $123.5 billion, or 5.6 percent, in 2017 to $2,331.6 billion. Exports of goods increased $95.0 billion and exports of services increased $28.5 billion.
- The largest increases in exports of goods were in industrial supplies and materials ($66.4 billion) and in capital goods ($13.2 billion).
- The largest increases in exports of services were in other business services ($12.2 billion), which includes research and development services; professional and management services; and technical, trade-related, and other services, in financial services ($8.2 billion), and in charges for the use of intellectual property ($3.5 billion).
Imports
Imports of goods and services increased $187.2 billion, or 6.9 percent, in 2017 to $2,900.0 billion. Imports of goods increased $153.7 billion and imports of services increased $33.5 billion.
- The largest increases in imports of goods were in industrial supplies and materials ($64.3 billion), in capital goods ($50.7 billion), and in consumer goods ($18.6 billion).
- The largest increases in imports of services were in travel (for all purposes including education) ($11.6 billion), in other business services ($5.9 billion), and in transport ($4.4 billion).
For more information, read the full report.