
The size of every county’s economy with industry detail will be officially released for the first time by the U.S. Bureau of Economic Analysis on Dec. 12.
BEA will estimate annual gross domestic product, or GDP, for the years 2001 through 2018 for more than 3,000 counties. The data will include contributions to GDP by 34 industries, such as manufacturing, retail trade, and health and social assistance.
Measuring GDP at the county level is a milestone in BEA’s efforts to better capture how economic activity is distributed across the nation. This new information, in high demand by data users, will complement the county personal income statistics BEA has produced since 1975.
GDP for counties and metropolitan statistical areas will be published together at 8:30 a.m. on Dec. 12 in a new joint release called Local Area Gross Domestic Product, 2018. It replaces the Gross Domestic Product by Metropolitan Area release of previous years.
BEA will continue to publish annual county and metro GDP statistics each December. In addition to industry contributions to GDP, the data will include current-dollar GDP; inflation-adjusted or real GDP; percent change from the preceding year; and quantity indexes.
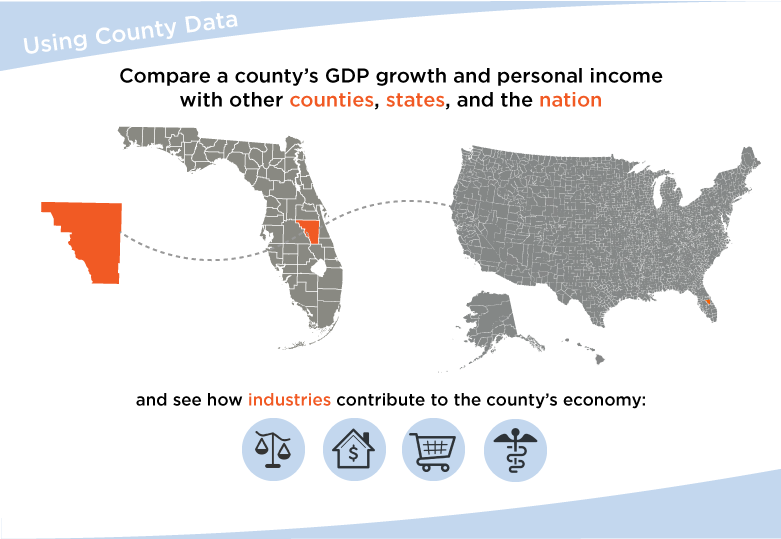
The county statistics can be used for comparisons to other counties, metropolitan areas, state economies, or the nation overall.
They can answer questions such as:
- What is the size of a county's economy?
- Is its economy growing or declining?
- In which industries does the county specialize?
- What industries are driving its growth?
- What has been the county’s economic growth trend over time?
Business owners, county officials, and policymakers at all levels of government can use these statistics to make better-informed decisions about investments, economic development, or economic policies.
High-quality, consistently defined time series data for counties across the United States will aid research into topics such as the distribution of national economic output, local economic dynamics, and the effectiveness of economic development strategies.
Like county personal income data, the new GDP statistics will cover 3,113 areas, including county equivalents such as Louisiana's parishes and Alaska's boroughs, the District of Columbia, and the independent cities in Maryland, Missouri, Nevada, and Virginia. Kalawao County, Hawaii, and the smaller independent cities of Virginia are combined with adjacent counties.
GDP statistics are based on the place of production, such as the county where an office or factory is located, regardless of where the workers live. This differs from BEA’s personal income statistics, which measure the incomes of all people residing in a county, no matter where they work.
For example, a person who works in Los Angeles and commutes home to Riverside County, Calif., contributes to Los Angeles County’s GDP but Riverside County’s personal income data.
BEA released prototype county GDP data last December and sought evaluation and feedback from data users. The responses and further research led BEA to refine its methodology and add significant industry detail to the coming official release.
Learn more on the county GDP page of bea.gov. On Dec. 12, all local area GDP data will be available through that page and in BEA’s Interactive Data.