
Personal income increased$225.9 billion, or 1.1 percent at a monthly rate, while consumer spending increased$42.2 billion, or 0.3 percent, in July. Compensation increased and new advance Child Tax Credit payments, authorized by the American Rescue Plan, began in July. In addition to presenting estimates for July 2021, these highlights provide comparisons to February 2020, the last month before the onset of the COVID-19 pandemic in the United States. For more information, see Federal Recovery Programs and BEA Statistics.
Personal income for July 2021
The increase in personal income in July primarily reflected increases in government social benefits and compensation of employees.
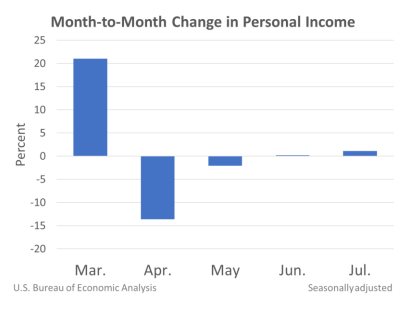
- Within government social benefits, an increase in "other" social benefits, reflecting new advance Child Tax Credit payments authorized by the American Rescue Plan, was partly offset by a decrease in unemployment insurance, reflecting decreases in payments from the Pandemic Unemployment Compensation program.
- Within compensation, the increase was primarily in private wages and salaries, reflecting Bureau of Labor Statistics Current Employment Statistics.
For more information on the new advance Child Tax Credit payments, see the FAQ "How does the Child Tax Credit provision of the American Rescue Plan Act of 2021 impact the NIPAs?" on the BEA website. Additional information on factors affecting monthly personal income can be found on Effects of Selected Federal Pandemic Response Programs on Personal Income.
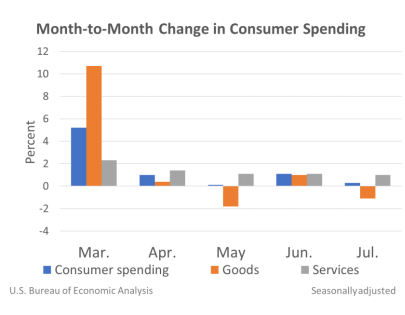
- The increase in services was led by food services and accommodations (notably, accommodations), based on private data from STR.
- Within goods, the decrease was widespread across both durable and nondurable goods, led by motor vehicles and parts (notably, new light trucks), based on Wards Intelligence unit sales data.
Consumer prices for July 2021
The personal consumption expenditures (PCE) price index for July increased 4.2 percent from one year ago, reflecting increases in both goods and services. Energy prices increased 23.6 percent while food prices increased 2.4 percent. Excluding food and energy, the PCE price index for July increased 3.6 percent from one year ago.
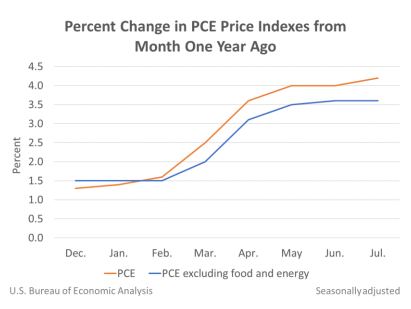
Compared to June 2021, the PCE price index increased 0.4 percent, reflecting increases in both goods and services. Energy prices increased 1.6 percent while food prices increased 0.6 percent. Excluding food and energy, the PCE price index increased 0.3 percent from June 2021 to July 2021.
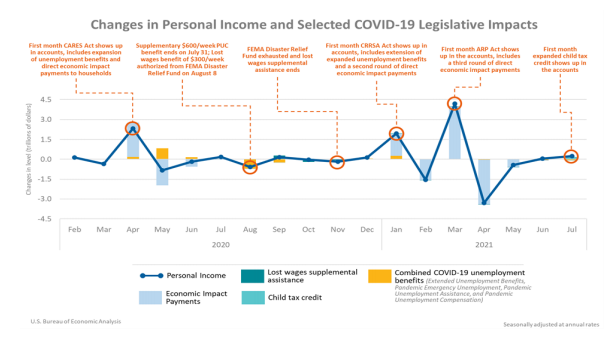
Personal income changes since February 2020
Over the past 17 months, changes in personal income primarily reflected changes in government social benefits, stemming from the enactment and expiration of legislative acts and related programs.
Consumer spending comparisons to February 2020
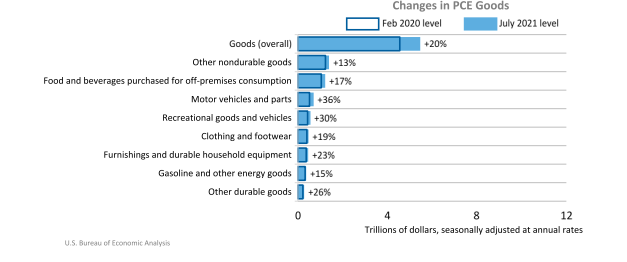
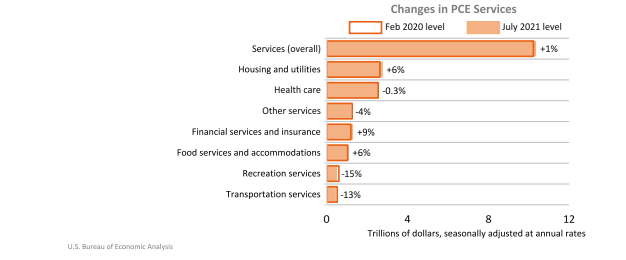
A comparison of the July 2021 current-dollar levels of consumer spending with the February 2020 pre-pandemic levels shows that spending for both goods and services increased.
Spending for goods in July 2021 was 20 percent above the February 2020 level. Categories with notable increases included motor vehicles and parts, recreational goods and vehicles (led by information processing equipment), and furnishings and durable household equipment.
Spending for services in July 2021 was 1 percent above the February 2020 level. Categories below their pre-pandemic levels include recreation and transportation services.
Since the onset of the pandemic, BEA has used traditional data sources along with alternative data sources, particularly payment card transactions, to estimate changes in the monthly pattern of consumer spending. Additional information is available at COVID-19 and Recovery: Estimates from Payment Card Transactions.
For more information, read the full release.