
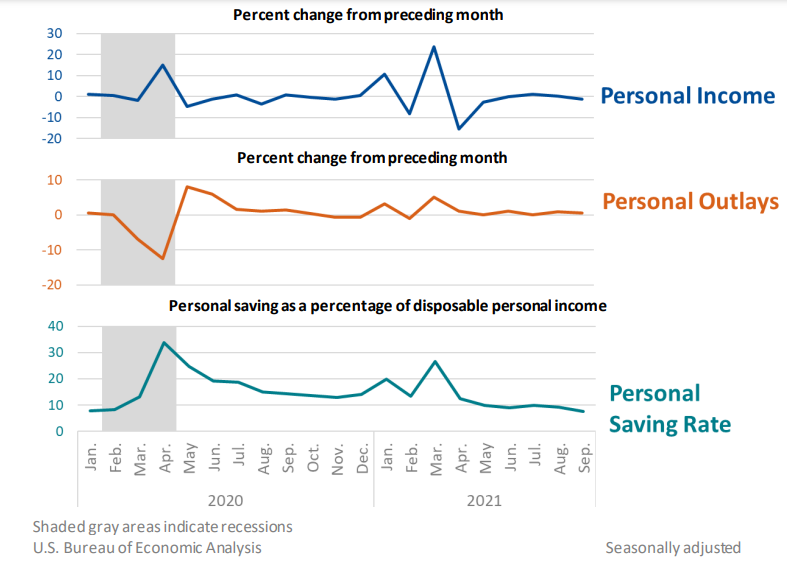
Personal income decreased$216.2 billion, or 1.0 percent at a monthly rate, while consumer spending increased$93.4 billion, or 0.6 percent, in September. The decrease in personal income primarily reflected the winding down of pandemic-related assistance programs. The personal saving rate (that is, personal saving as a percentage of disposable personal income) was 7.5 percent in September, compared with 9.2 percent in August.
Personal income
In September, personal income decreased, primarily reflecting a decrease in government social benefits, both in unemployment benefits and “other” benefits.
- Within unemployment benefits, there were decreases in three pandemic-related unemployment programs: Pandemic Unemployment Compensation Payments, Pandemic Emergency Unemployment Compensation, and Pandemic Unemployment Assistance. All three programs were originally authorized by the Coronavirus Aid, Relief and Economic Security Act with an extension of benefits until September 6, 2021 through the American Rescue Plan Act of 2021. Information on each of these programs can be found at the FAQ How will the expansion of unemployment benefits in response to the COVID-19 pandemic be recorded in the NIPAs?.
- Within “other” social benefits, several pandemic-related programs decreased, including the Provider Relief Fund (funds provided to nonprofit hospitals to support health care-related expenses or lost revenue), economic impact payments (funds provided in three rounds of direct support payments to individuals), and Paycheck Protection Program loans to nonprofit institutions (funds provided to help nonprofits make payroll and cover other expenses). Information on each of these programs is available at Federal Recovery Programs and BEA Statistics.
Additional information on factors affecting monthly personal income can be found on Effects of Selected Federal Pandemic Response Programs on Personal Income.
Consumer spending
Personal outlays increased in September, primarily reflecting an increase in consumer spending for both goods and services.
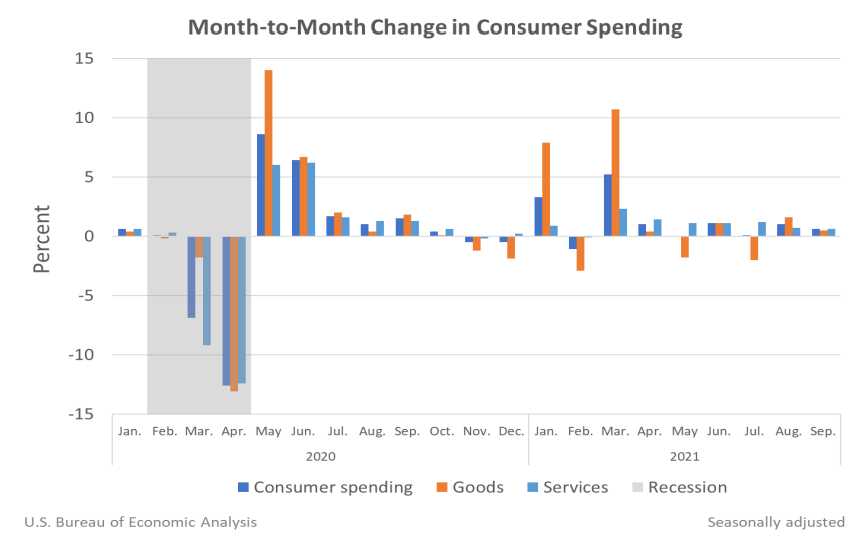
- Within goods, an increase in nondurable goods was partly offset by a decrease in durable goods. Page 3 of 3
- The increase in nondurable goods primarily reflected increases in food and beverages, based on data from the Census Monthly Retail Trade Survey; “other” nondurable goods, notably pharmaceutical products, based on data from IMS Health; and gasoline and other energy goods, based on data from the Energy Information Administration.
- The decrease in durable goods primarily reflected a decrease in motor vehicles and parts, led by new motor vehicles (both autos and light trucks), based on data from Wards Intelligence.
- The increase in nondurable goods primarily reflected increases in food and beverages, based on data from the Census Monthly Retail Trade Survey; “other” nondurable goods, notably pharmaceutical products, based on data from IMS Health; and gasoline and other energy goods, based on data from the Energy Information Administration.
- Within services, the increase primarily reflected increases in health care as well as food services and accommodations. The increase in health care was led by hospital and nursing home services, based on data from the Bureau of Labor Statistics Current Employment Statistics as well as data from trade sources. The increase in food services and accommodations was led by accommodations, based on private data from STR.
PCE price index
The personal consumption expenditures (PCE) price index for September increased 4.4 percent from one year ago, reflecting increases in both goods and services. Energy prices increased 24.9 percent while food prices increased 4.1 percent. Excluding food and energy, the PCE price index for September increased 3.6 percent from one year ago.
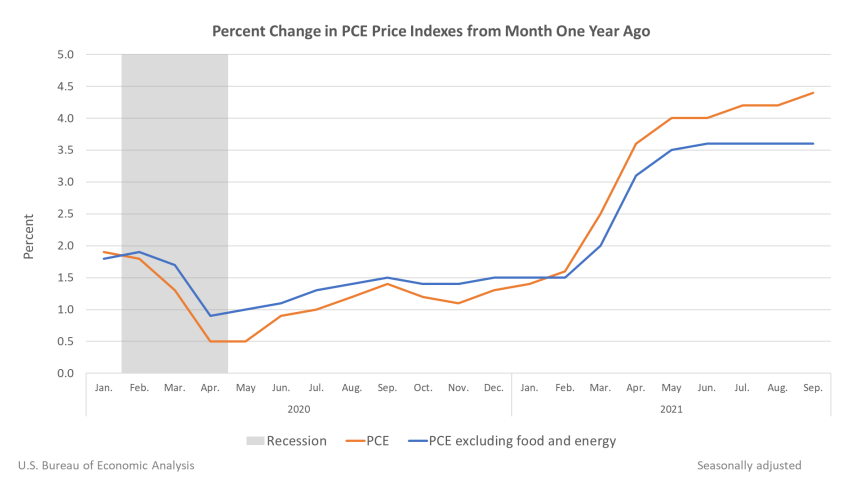
Compared to August 2021, the PCE price index increased 0.3 percent, reflecting increases in both goods and services. Energy prices increased 1.3 percent while food prices increased 1.1 percent. Excluding food and energy, the PCE price index increased 0.2 percent from August 2021 to September 2021.