
Personal income increased $93.4 billion, or 0.5 percent at a monthly rate, while consumer spending increased$214.3 billion, or 1.3 percent, in October. The increase in personal income primarily reflected an increase in compensation of employees. The personal saving rate (that is, personal saving as a percentage of disposable personal income) was 7.3 percent in October, compared with 8.2 percent in September.
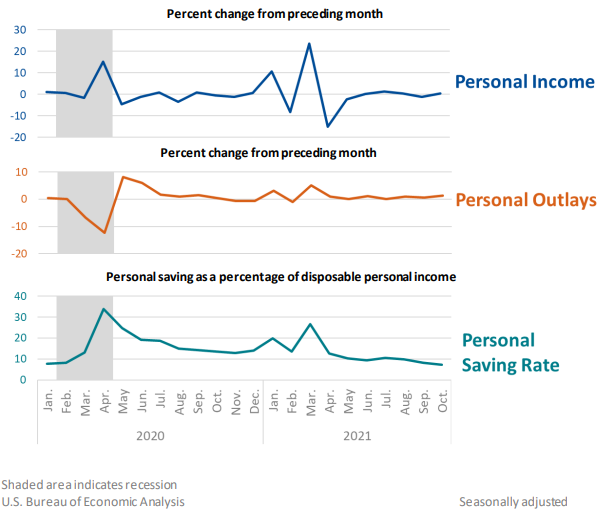
Personal income
In October, personal income increased, primarily reflecting increases in compensation of employees and personal income receipts on assets. Partly offsetting these increases was a decrease in government social benefits, notably unemployment insurance.
- Within compensation of employees, the increase primarily reflected an increase in wages and salaries, based on data from the Bureau of Labor Statistics Current Employment Statistics. Wages and salaries of services-producing industries increased $76.9 billion, while wages and salaries of goods producing industries increased $10.4 billion.
- Personal income on assets increased $25.5 billion. Personal dividend income increased $15.8 billion while personal interest income increased $9.7 billion.
- Within unemployment benefits, there were decreases in three pandemic-related unemployment programs: Pandemic Unemployment Compensation Payments, Pandemic Emergency Unemployment Compensation, and Pandemic Unemployment Assistance. All three programs were originally authorized by the Coronavirus Aid, Relief and Economic Security Act with an extension of benefits provided through the American Rescue Plan Act of 2021. Information on each of these programs can be found at the FAQ How will the expansion of unemployment benefits in response to the COVID-19 pandemic be recorded in the NIPAs?.
Additional information on factors affecting monthly personal income can be found on Effects of Selected Federal Pandemic Response Programs on Personal Income.
Consumer spending
Personal outlays increased in October, reflecting an increase in consumer spending for both goods and services.
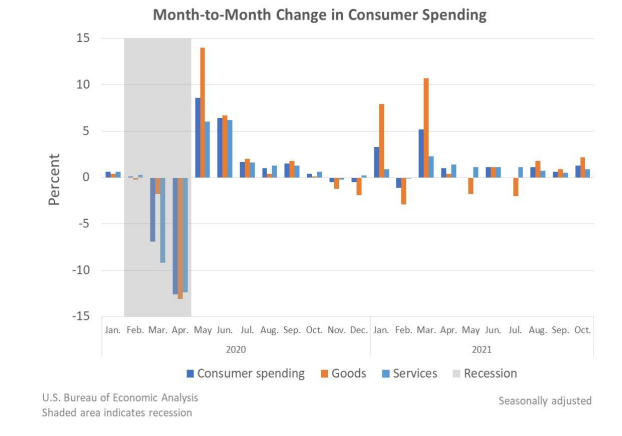
- Within goods, both durable and nondurable goods increased.
- The increase in durable goods primarily reflected increases in motor vehicles and parts, led by new motor vehicles (light trucks), based on data from Wards Intelligence; and recreational goods and vehicles, led by video, audio, photographic and information processing equipment, based on data from the Census Monthly Retail Trade Survey.
- The increase in nondurable goods primarily reflected increases in “other” nondurable goods, notably pharmaceutical products, based on data from IMS Health; gasoline and other energy goods, based on price data from the Bureau of Labor Statistics (BLS); and food and beverages, based on data from the Census Monthly Retail Trade Survey.
- The increase in durable goods primarily reflected increases in motor vehicles and parts, led by new motor vehicles (light trucks), based on data from Wards Intelligence; and recreational goods and vehicles, led by video, audio, photographic and information processing equipment, based on data from the Census Monthly Retail Trade Survey.
- Within services, the increase reflected increases in “other” services, notably international travel by U.S. residents, based on information from BEA’s International Transaction Accounts; housing and utilities, led by housing; and health care, led by outpatient services, based on data from the BLS Current Employment Statistics as well as private data.
PCE price index
The personal consumption expenditures (PCE) price index for October increased 5.0 percent from one year ago, reflecting increases in both goods and services. Energy prices increased 30.2 percent while food prices increased 4.8 percent. Excluding food and energy, the PCE price index for October increased 4.1 percent from one year ago.
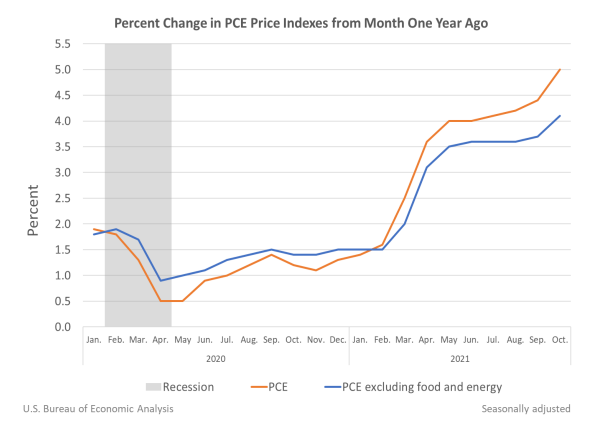
Compared to September 2021, the PCE price index increased 0.6 percent, reflecting increases in both goods and services. Energy prices increased 4.9 percent while food prices increased 0.8 percent. Excluding food and energy, the PCE price index increased 0.4 percent from September 2021 to October 2021.
For more information, read the full release.