
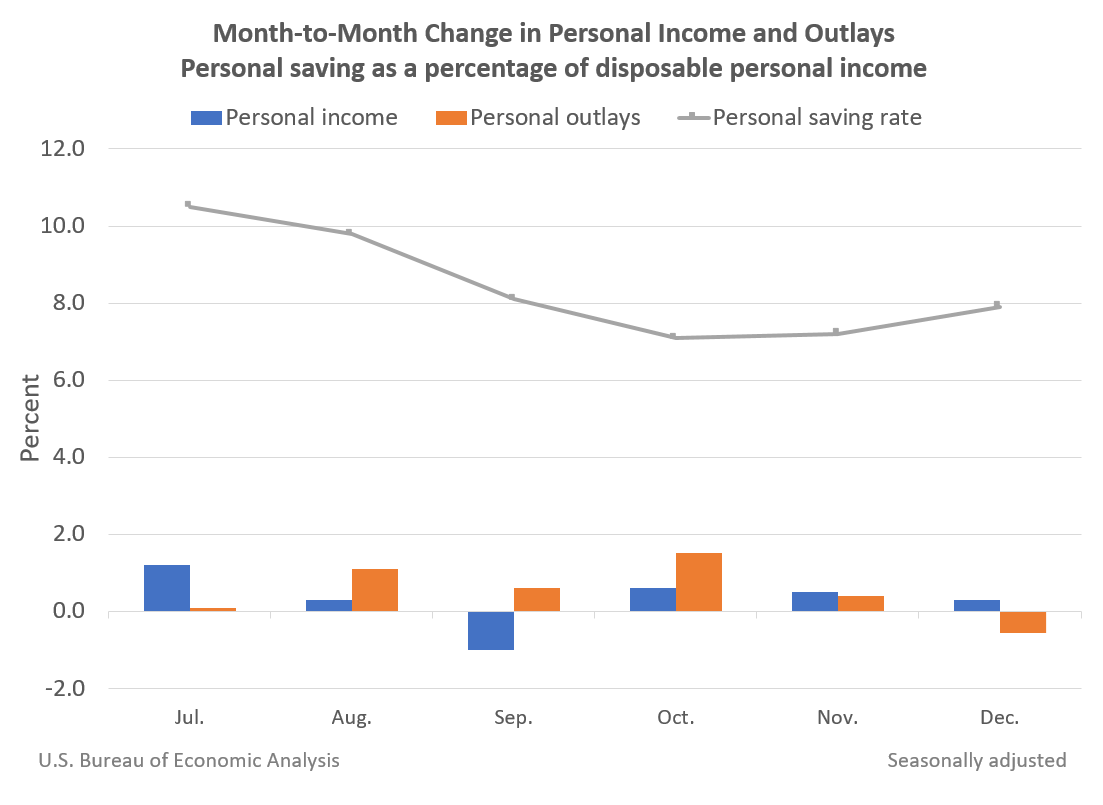
Personal income increased$70.7 billion, or 0.3 percent at a monthly rate, while consumer spending decreased$95.2 billion, or 0.6 percent, in December. The increase in personal income primarily reflected an increase in compensation of employees. The personal saving rate (that is, personal saving as a percentage of disposable personal income) was 7.9 percent in December, compared with 7.2 percent in November.
Personal income
In December, personal income increased, primarily reflecting an increase in compensation of employees that was partly offset by a decrease in proprietors’ income. Government social benefits decreased slightly, reflecting the winding down of pandemic-related assistance programs.
- Within compensation of employees, the increase primarily reflected an increase in wages and salaries, based on data from the Bureau of Labor Statistics (BLS) Current Employment Statistics(CES). Wages and salaries of services-producing industries increased $64.5 billion, while wages and salaries of goods-producing industries increased $5.7 billion.
- Proprietors’ income declined $26.5 billion, reflecting decreases in both farm and nonfarm. The decrease in farm proprietors’ income reflected the winding down of two pandemic-related programs, the Coronavirus Food Assistance Program and the Paycheck Protection Program. The decrease in nonfarm proprietors’ income also reflected the winding down of the Paycheck Protection Program.
- Within government social benefits, pandemic-related programs continued to wind down. Notably, economic impact payments and unemployment benefits declined. Additional information on factors affecting monthly personal income can be found on Effects of Selected Federal Pandemic Response Programs on Personal Income.
Consumer spending
Personal outlays decreased in December, primarily reflecting a decrease in consumer spending for goods that was partly offset by an increase in consumer spending for services.
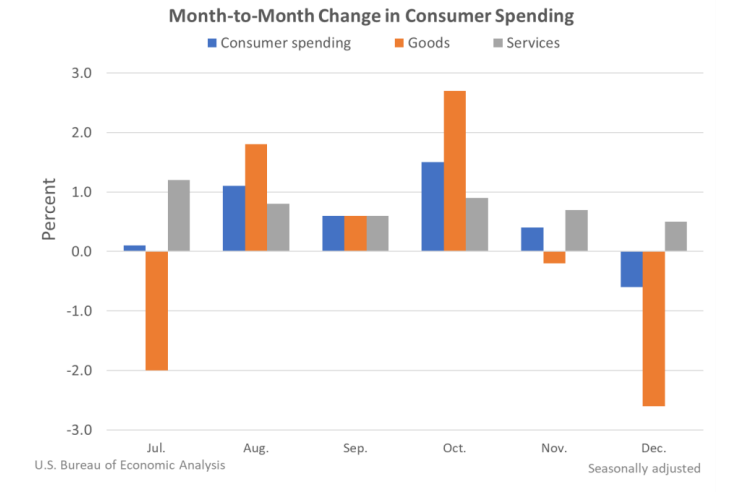
- Within goods, both durable and nondurable goods decreased.
- The decrease in durable goods primarily reflected decreases in recreational goods and vehicles, led by video, audio, photographic and information processing equipment, as well as furnishings and durable household equipment, led by furniture, based on data from the Census Monthly Retail Trade Survey (MRTS).
- The decrease in nondurable goods primarily reflected a decrease in “other” nondurable goods, which includes newspapers, household supplies, and games and toys, based on MRTS data.
- The decrease in durable goods primarily reflected decreases in recreational goods and vehicles, led by video, audio, photographic and information processing equipment, as well as furnishings and durable household equipment, led by furniture, based on data from the Census Monthly Retail Trade Survey (MRTS).
- Within services, the increase primarily reflected an increase in health care, led by hospital and nursing home services, based on data from the BLS CES as well as private data.
PCE price index
The personal consumption expenditures (PCE) price index for December increased 5.8 percent from one year ago, reflecting increases in both goods and services. Energy prices increased 29.9 percent while food prices increased 5.7 percent. Excluding food and energy, the PCE price index for December increased 4.9 percent from one year ago.
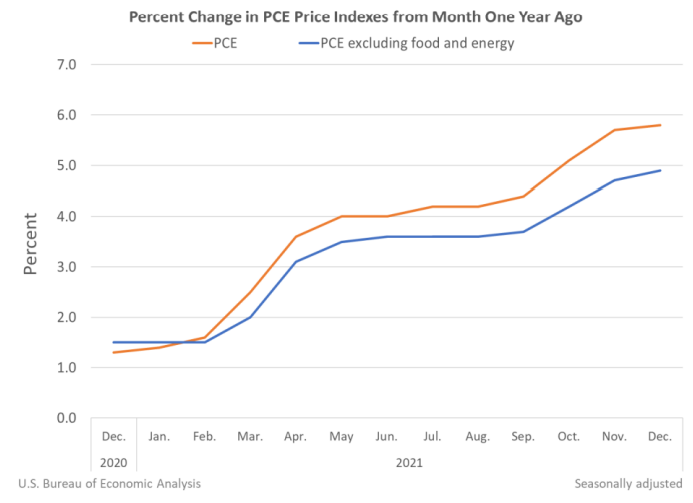
Compared to November 2021, the PCE price index increased 0.4 percent, reflecting increases in both goods and services. Energy prices decreased 0.4 percent while food prices increased 0.3 percent. Excluding food and energy, the PCE price index increased 0.5 percent from November to December 2021.
For more information read the full release.