
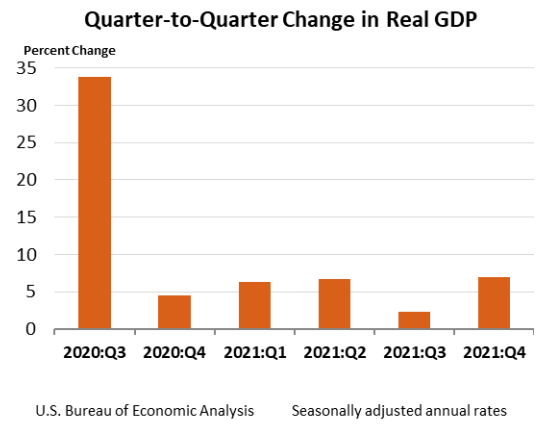
Real gross domestic product (GDP) increased at an annual rate of 7.0 percent in the fourth quarter of 2021, following an increase of 2.3 percent in the third quarter. The increase was revised up 0.1 percentage point from the “advance” estimate released in January. The acceleration in the fourth quarter was led by an upturn in exports as well as accelerations in inventory investment and consumer spending. In the fourth quarter, COVID-19 cases resulted in continued restrictions and disruptions in the operations of establishments in some parts of the country. Government assistance payments in the form of forgivable loans to businesses, grants to state and local governments, and social benefits to households all decreased as provisions of several federal programs expired or tapered off. For more details, including source data, refer to the Technical Note and Federal Recovery Programs and BEA Statistics.
Quarterly GDP Highlights
The fourth quarter increase in real GDP primarily reflected increases in inventory investment, exports, consumer spending, and business investment that were partly offset by decreases in both federal and state and local government spending. Imports, which are a subtraction in the calculation of GDP, increased.
- The increase in inventory investment primarily reflected increases in retail(led by motor vehicle and parts dealers) and wholesale (led by durable goods industries).
- The increase in exports reflected increases in both goods (led by consumer goods) and services (led by travel).
- The increase in consumer spending primarily reflected an increase in services(led by health care, financial services and insurance, and transportation). Consumer spending for goods also increased (led by recreational goods and vehicles).
- The increase in business investment primarily reflected an increase in intellectual property products (led by research and development as well as software)that was partly offset by a decrease in structures (led by commercial and health care).
- The decrease in federal government spending primarily reflected a decrease in defense spending on intermediate goods and services (led by services).
- The decrease in state and local government spending reflected a decrease in gross investment (led by new educational structures).
Updates to GDP
The update reflects upward revisions to business investment, state and local government, and housing investment that were partly offset by downward revisions to consumer spending and exports.
Quarterly Personal Income and Saving
Real disposable personal income (DPI)—personal income adjusted for taxes and inflation—decreased5.6 percent in the fourth quarter after decreasing 4.1 percent (revised) in the third quarter.
Current-dollar DPI—personal income adjusted for taxes but not inflation—increased 0.4 percent in the fourth quarter after increasing 1.0 percent (revised) in the third quarter, primarily reflecting an increase in compensation of employees. Personal saving as a percentage of DPI was 7.6 percent in the fourth quarter, compared with 9.5 percent (revised) in the third quarter.
Quarterly Prices
Prices of goods and services purchased by U.S. residents increased 7.0 percent in the fourth quarter after increasing 5.6 percent in the third quarter.
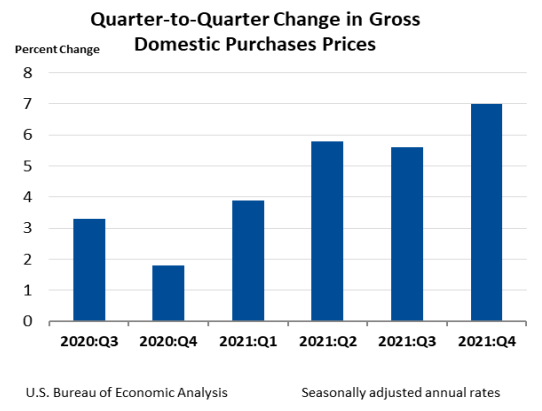
- Energy prices increased 33.9 percent in the fourth quarter while food prices increased 9.0 percent.
- Excluding food and energy, prices increased 6.2 percent in the fourth quarter after increasing 5.1 percent in the third quarter.
Year 2021 Highlights
Real GDP increased 5.7 percent (from the 2020 annual level to the 2021 annual level), unchanged from the prior estimate, in contrast to a decrease of 3.4 percent in 2020. The increase reflected increases in all major components: consumer spending, business investment, exports, housing investment, and inventory investment. Imports increased.

- The increase in consumer spending reflected increases in goods and services. Within goods, the leading contributors were "other" nondurable goods (including games and toys as well as pharmaceuticals), clothing and footwear, and recreational goods and vehicles. Within services, the leading contributors were food services and accommodations as well as health care.
- The increase in business investment reflected increases in equipment (led by information processing equipment) and intellectual property products (led by software as well as research and development). These increases were partly offset by a decrease in structures.
For more information, read the full release.