
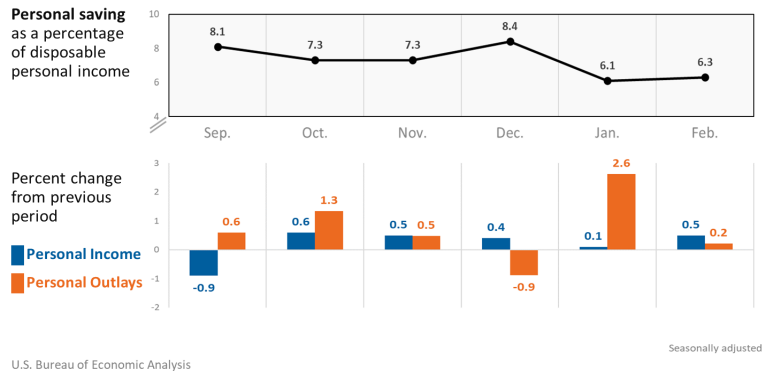
Personal income increased $101.5 billion, or 0.5 percent at a monthly rate, while consumer spending increased $34.9 billion, or 0.2 percent, in February. The increase in personal income primarily reflected an increase in compensation of employees that was partly offset by a decrease in government social benefits. The personal saving rate (that is, personal saving as a percentage of disposable personal income) was 6.3 percent in February, compared with 6.1 percent in January.
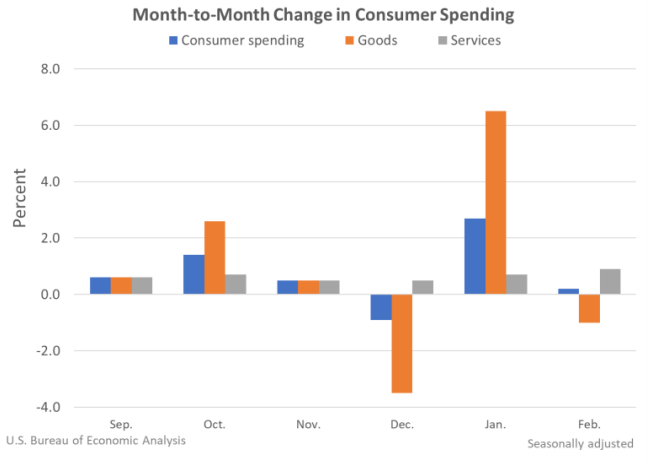
Consumer spending
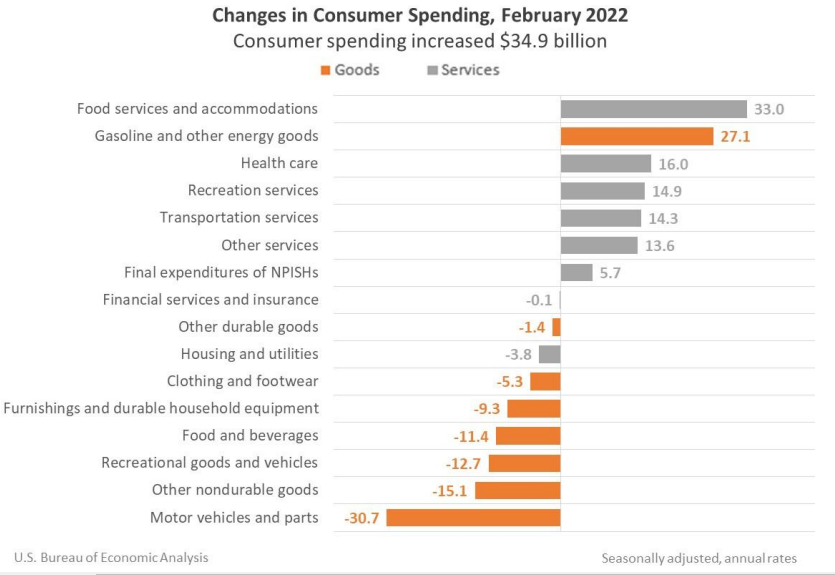
Personal outlays increased in February, primarily reflecting an increase in consumer spending for services. Consumer spending for goods declined.
- Within services, the increase primarily reflected an increase in food services and accommodations (led by food services) based on data from the Census Monthly Retail Trade Survey.
- Within goods, the decrease primarily reflected a decrease in motor vehicles and parts (led by new motor vehicles, specifically, light trucks), based on unit sales data from Wards Intelligence. The decrease was partly offset by an increase in gasoline and other energy goods (led by motor vehicle fuels, lubricants, and fluids), based on data from the Energy Information Administration.
PCE price index
The personal consumption expenditures (PCE) price index for February increased 6.4 percent from one year ago, reflecting increases in both goods and services. Energy prices increased 25.7 percent while Page 3 of 3 food prices increased 8.0 percent. Excluding food and energy, the PCE price index for February increased 5.4 percent from one year ago.
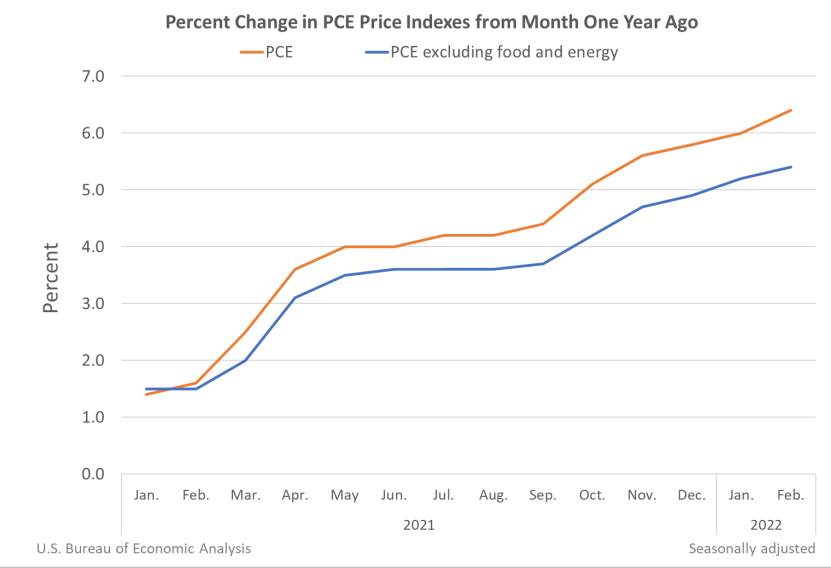
Compared to January, the PCE price index increased 0.6 percent, reflecting increases in both goods and services. Energy prices increased 3.7 percent while food prices increased 1.4 percent. Excluding food and energy, the PCE price index increased 0.4 percent from January to February.
For a comparison of PCE prices to BLS consumer price indexes, refer to NIPA Table 9.1U. Reconciliation of Percent Change in the CPI with Percent Change in the PCE Price Index.
For more information, read the full release.