
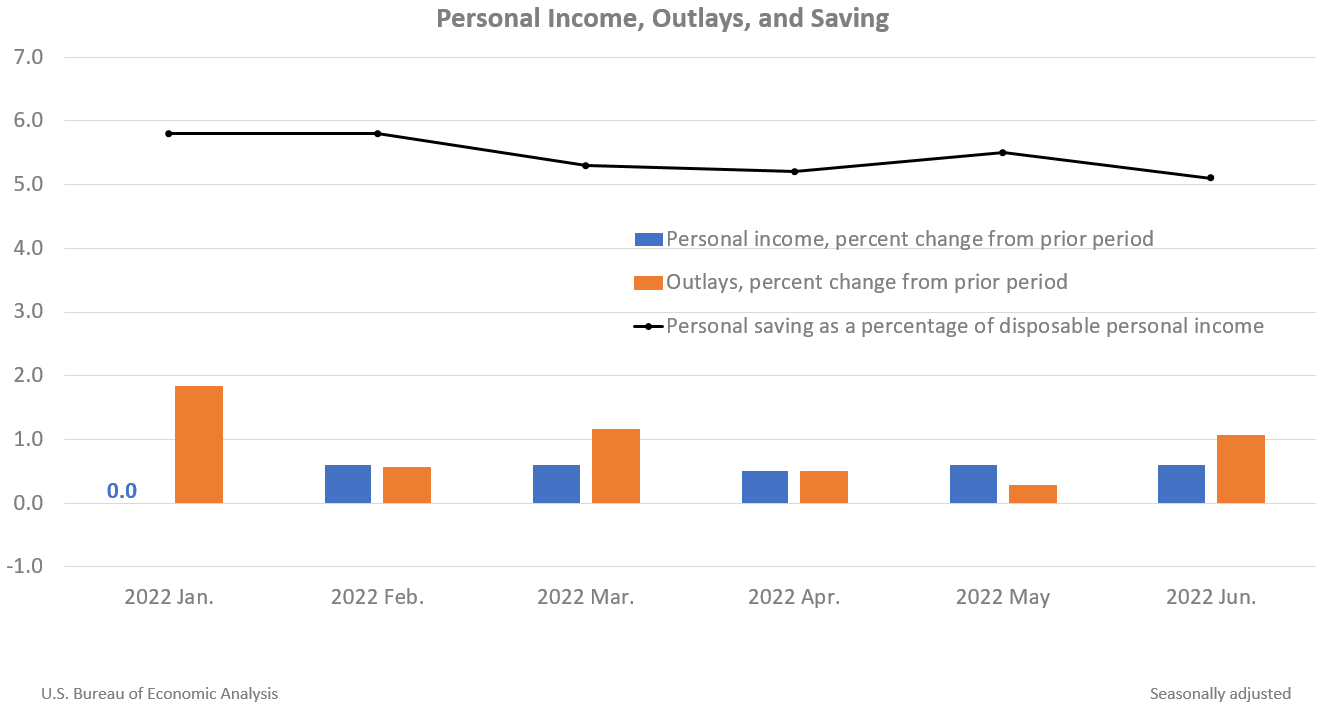
Personal income increased $133.5 billion, or 0.6 percent at a monthly rate, while consumer spending increased $181.1 billion, or 1.1 percent, in June. The increase in personal income primarily reflected increases in compensation and proprietors’ income. The personal saving rate (that is, personal saving as a percentage of disposable personal income) was 5.1 percent in June, compared with 5.5 percent in May.
Personal income
In June, personal income increased, primarily reflecting increases in compensation and proprietors’ income.
- Within compensation, the increase primarily reflected an increase in private wages and salaries, based on data from the Bureau of Labor Statistics (BLS) Current Employment Statistics (CES). Wages and salaries of services-producing industries increased $48.1 billion, while wages and salaries of goods-producing industries increased $2.0 billion.
- Proprietors’ income increased, largely reflecting an increase in nonfarm income.
- Other current transfer receipts increased $12.9 billion in June, reflecting a legal settlement from corporate business to persons.
Consumer spending
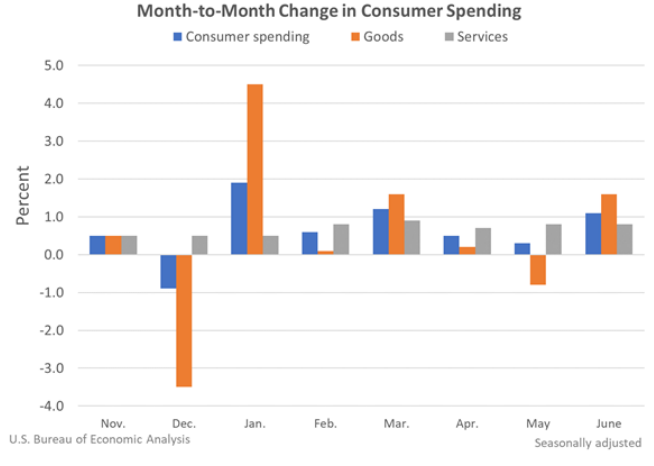
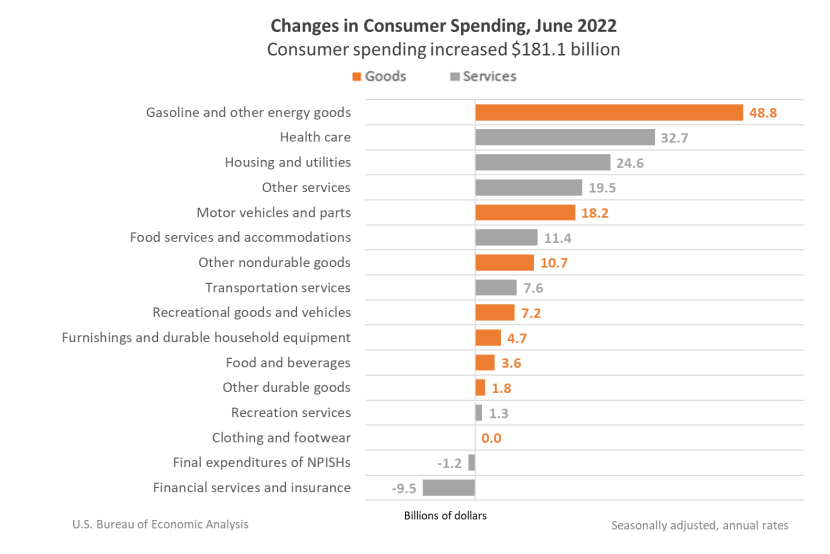
Personal outlays increased in June, reflecting an increase in consumer spending for goods and services.
- Within goods, the primary contributors to the increase were gasoline and other energy goods (led by motor vehicle fuels), based on data from the Energy Information Administration; and motor vehicle and parts (led by new motor vehicles, specifically new light trucks), based on unit sales from Wards Intelligence.
- Within services, the largest contributors to the increase were health care (led by hospitals), based on private data and the BLS CES; housing and utilities (led by housing), based on housing completions data from the Census Bureau; and “other” services (led by international travel).
PCE price index
The personal consumption expenditures (PCE) price index for June increased 6.8 percent from one year ago, reflecting increases in both goods and services. Energy prices increased 43.5 percent while food prices increased 11.2 percent. Excluding food and energy, the PCE price index for June increased 4.8 percent from one year ago.
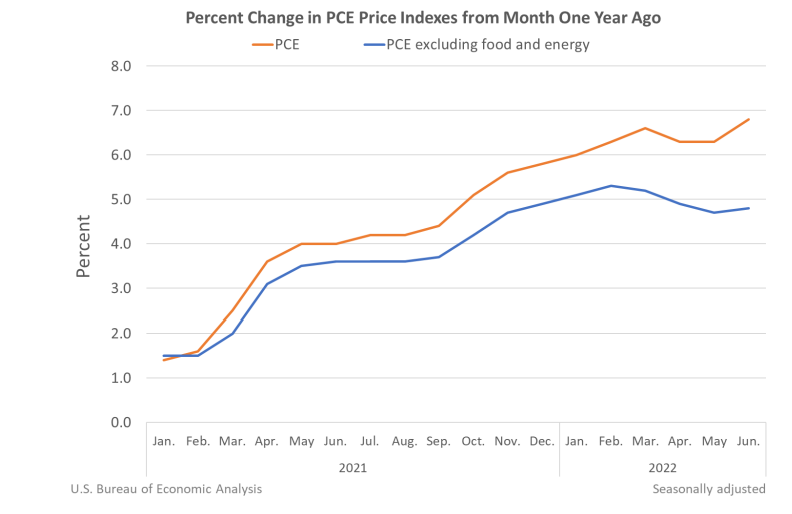
Compared to May, the PCE price index increased 1.0 percent. Energy prices increased 7.5 percent and food prices increased 1.0 percent. Excluding food and energy, the PCE price index increased 0.6 percent from May to June. For a comparison of PCE prices to BLS consumer price indexes, refer to NIPA Table 9.1U. Reconciliation of Percent Change in the CPI with Percent Change in the PCE Price Index.
Real disposable personal income and consumer spending
Real disposable personal income decreased 0.3 percent in June and real consumer spending increased 0.1 percent; goods increased 0.1 percent and services increased 0.1 percent. Within goods, an increase in durable goods (led by motor vehicles and parts) was partly offset by a decrease in nondurable goods (led by food and beverages). Within services, the leading contributors were health care, food services and accommodations, and "other" services (led by international travel).
For more information, read the full release.