
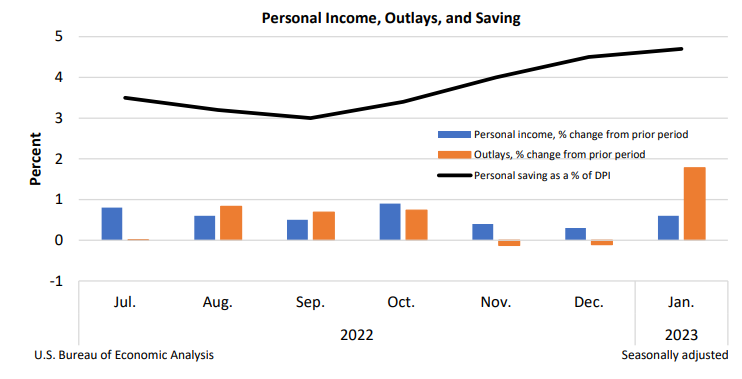
Personal income increased $131.1 billion, or 0.6 percent at a monthly rate, while consumer spending increased $312.5 billion, or 1.8 percent, in January. The increase in personal income primarily reflected an increase in compensation. Government social benefits decreased in January, reflecting a decrease in “other” benefits that was partly offset by an increase in Social Security. The personal saving rate (that is, personal saving as a percentage of disposable personal income) was 4.7 percent in January, compared with 4.5 percent in December.
Personal income
In January, personal income increased, primarily reflecting an increase in compensation.
- Within compensation, the increase primarily reflected an increase in private wages and salaries, based on data from the Bureau of Labor Statistics’ Current Employment Statistics. The increase reflected increases of $78.0 billion in services-producing industries and $22.0 billion in goods-producing industries.
- Government social benefits decreased in January, reflecting a decrease in “other” benefits that was partly offset by an increase in Social Security.
- The decrease in “other” benefits primarily reflected the expiration of the extended child tax credit (as authorized by the American Rescue Plan) as well as a decline in one-time refundable tax credits issued by states.
- The increase in Social Security primarily reflected an 8.7 percent cost-of-living adjustment.
- The decrease in “other” benefits primarily reflected the expiration of the extended child tax credit (as authorized by the American Rescue Plan) as well as a decline in one-time refundable tax credits issued by states.
Consumer spending
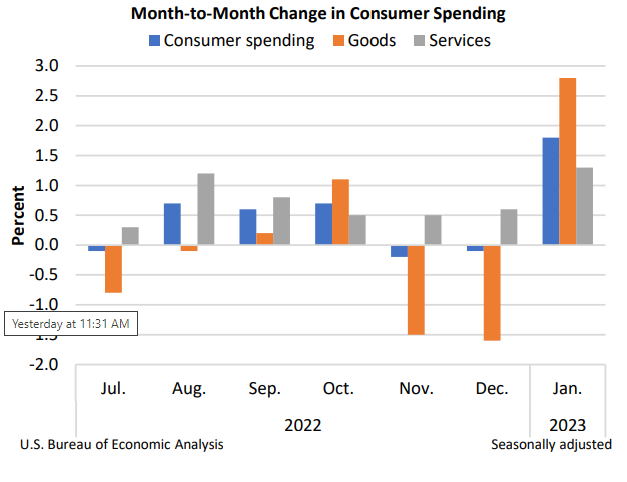
Personal outlays increased in January, primarily reflecting an increase in consumer spending for both goods and services.
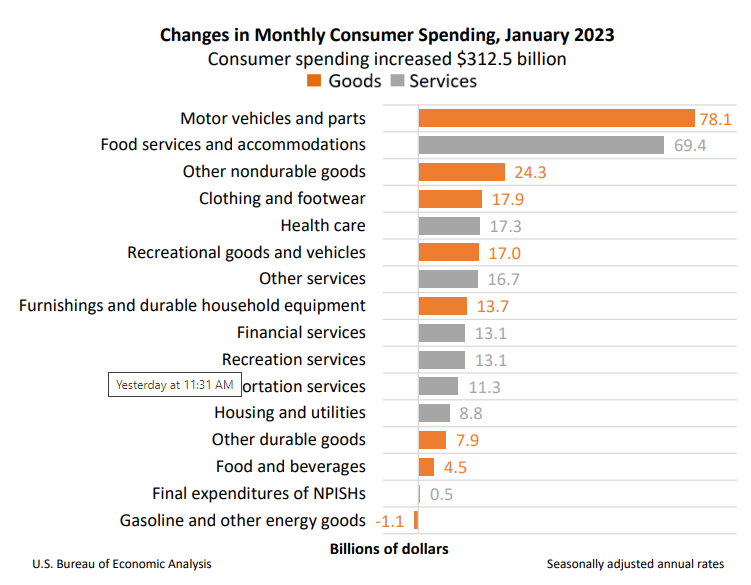
- Within goods, the largest contributors to the increase were motor vehicles and parts (led by new light trucks), based on unit sales data from Wards Intelligence, and “other” nondurable goods (led by pharmaceutical products and recreational items), based primarily on Census Bureau Monthly Retail Trade Survey (MRTS) data.
- Within services, the largest contributor to the increase was food services and accommodations (led by purchased meals and beverages), based primarily on Census MRTS data.
PCE price index
The personal consumption expenditures (PCE) price index for January increased 5.4 percent from one year ago, reflecting increases in both goods and services. Energy prices increased 9.6 percent while food prices increased 11.1 percent. Excluding food and energy, the PCE price index for January increased 4.7 percent from one year ago.
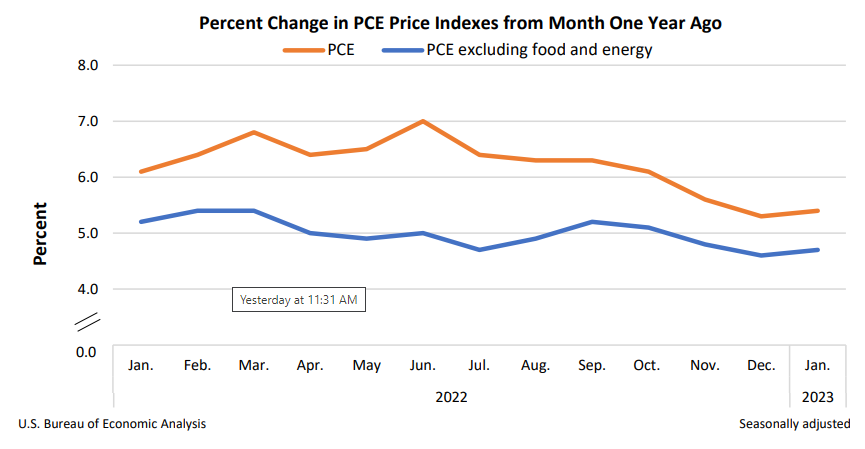
Compared to December, the PCE price index increased 0.6 percent. Energy prices increased 2.0 percent and food prices increased 0.4 percent. Excluding food and energy, the PCE price index increased 0.6 percent from December to January. For a comparison of PCE prices to BLS consumer price indexes, refer to NIPA Table 9.1U. Reconciliation of Percent Change in the CPI with Percent Change in the PCE Price Index.
Real disposable personal income and consumer spending
Real disposable personal income increased 1.4 percent in January and real consumer spending increased 1.1 percent; spending on goods increased 2.2 percent and spending on services increased 0.6 percent. Within goods, increases in motor vehicles and parts as well as recreational goods were partly offset by a decrease in gasoline. Within services, an increase in food services and accommodations was partly offset by a decrease in housing and utilities (notably, utilities).
For more information, read the full release.