
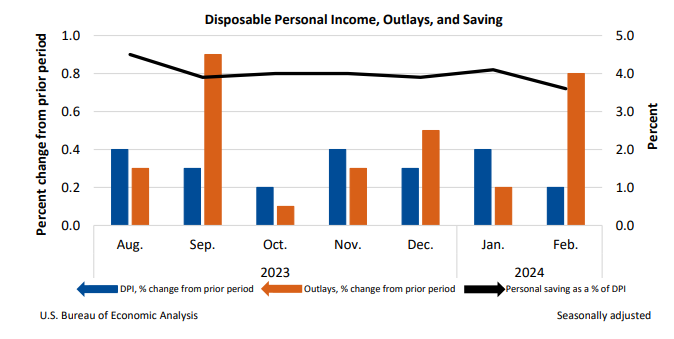
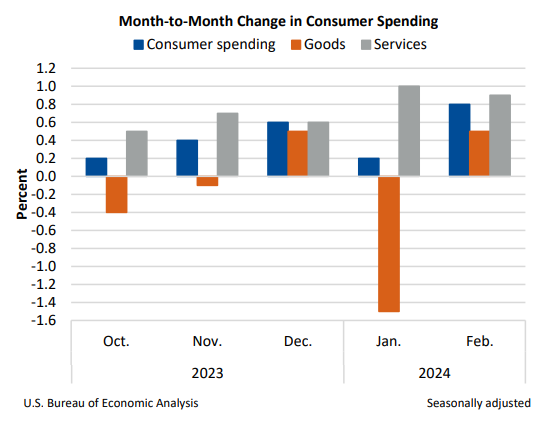
Personal income increased $66.5 billion (0.3 percent at a monthly rate) in February. Disposable personal income —personal income less personal current taxes—increased $50.3 billion (0.2 percent). Personal outlays—the sum of personal consumption expenditures, personal interest payments, and personal current transfer payments—increased $149.9 billion (0.8 percent) and consumer spending increased $145.5 billion (0.8 percent). Personal saving was $745.7 billion and the personal saving rate—personal saving as a percentage of disposable personal income—was 3.6 percent in February.
Personal income
In February, personal income increased, primarily reflecting increases in compensation and personal current transfer receipts that were partly offset by a decrease in personal income receipts on assets.
- Within compensation, the increase was led by private wages and salaries, based on data from the Bureau of Labor Statistics’ (BLS) Current Employment Statistics (CES). Services-producing industries increased $64.7 billion and goods-producing industries increased $15.0 billion.
- Within personal current transfer receipts, the increase was led by other government social benefits (notably, enrollments in Affordable Care Act plans).
- The decrease in personal income receipts on assets was led by personal dividend income, reflecting a return to normal levels following a special dividend paid by Costco Wholesale Corporation in January.
Consumer spending
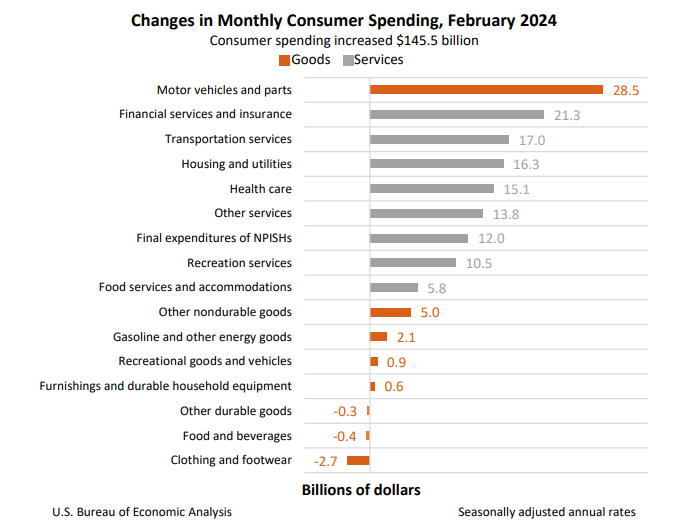
The $145.5 billion increase in consumer spending in February reflected an increase in spending for both services and goods.
- Within services, the largest contributors to the increase were financial services and insurance (led by financial service charges, fees, and commissions), based on Federal Deposit Insurance Corporation data; transportation services (led by air transportation), based on Transportation Security Administration data on the number of travelers; and housing and utilities (led by housing), based on BLS data.
- Within goods, the largest contributor to the increase was motor vehicles and parts (led by new light trucks), based on unit sales data from Wards Intelligence.
PCE price index
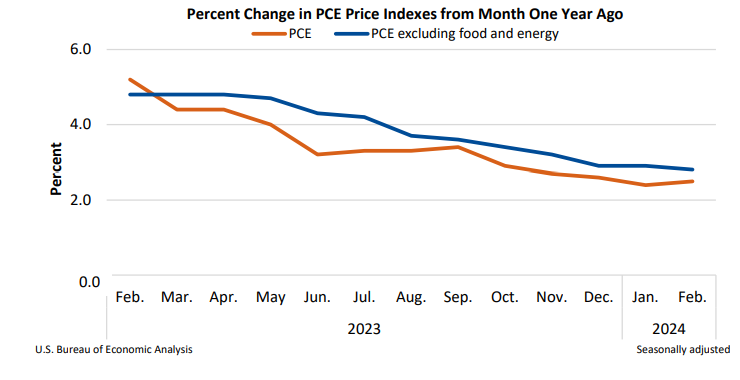
From the preceding month, the PCE price index for February increased 0.3 percent. Food prices increased 0.1 percent and energy prices increased 2.3 percent. Excluding food and energy, the PCE price index increased 0.3 percent. For a comparison of PCE prices to BLS consumer price indexes, refer to Table 9.1U. Reconciliation of Percent Change in the CPI with Percent Change in the PCE Price Index.
From the same month one year ago, the PCE price index for February increased 2.5 percent. Prices for services increased 3.8 percent and prices for goods decreased 0.2 percent. Food prices increased 1.3 percent and energy prices decreased 2.3 percent. Excluding food and energy, the PCE price index increased 2.8 percent from one year ago.
Real disposable personal income and consumer spending
Real DPI decreased 0.1 percent in February. Real consumer spending increased 0.4 percent, reflecting an increase in spending on services of 0.6 percent and an increase in spending on goods of 0.1 percent. Within services, the largest contributors to the increase were other services (led by international travel), transportation services (led by air transportation), and financial services and insurance (led by financial service charges, fees, and commissions). Within goods, the leading contributor to the increase was motor vehicles and parts (mainly new light trucks).
For more information, read the full release.