Skip to main content
An official website of the United States government
Toggle navigation
Main navigation
Data
by Topic
by Place
by Economic Account
Tools
Interactive Data
Application Programming Interface (API)
Global Value Chain Analyzer
Income Distribution Analysis Tool (IDAT)
Country Facts
BEARFACTS
Industry Facts
GDP & Personal Income Mapping
RIMS II
eFile
News
Economy at a Glance
News Releases
Release Schedule
The BEA Wire | BEA's Official Blog
Survey of Current Business
Archive
For Journalists
Research
Offices of Research
Meet the Researchers
Papers
Special Sworn Researcher Program
Research Using Company-Level Data
Fellowship Program
Resources
Learning Center
Methodologies
Multimedia
Article Collections
For Congressional Users
For Developers
For Students
About
Who We Are
BEA Leadership
Innovation at BEA
Advisory Committees
Budget and Performance
Policies and Information
Working at BEA
Help
Contact Us
Ask an Expert
For Survey Respondents
Frequently Asked Questions (FAQ)
Glossary
Guidelines for Citing BEA
Home
Resources
Multimedia
Multimedia
Featured Multimedia
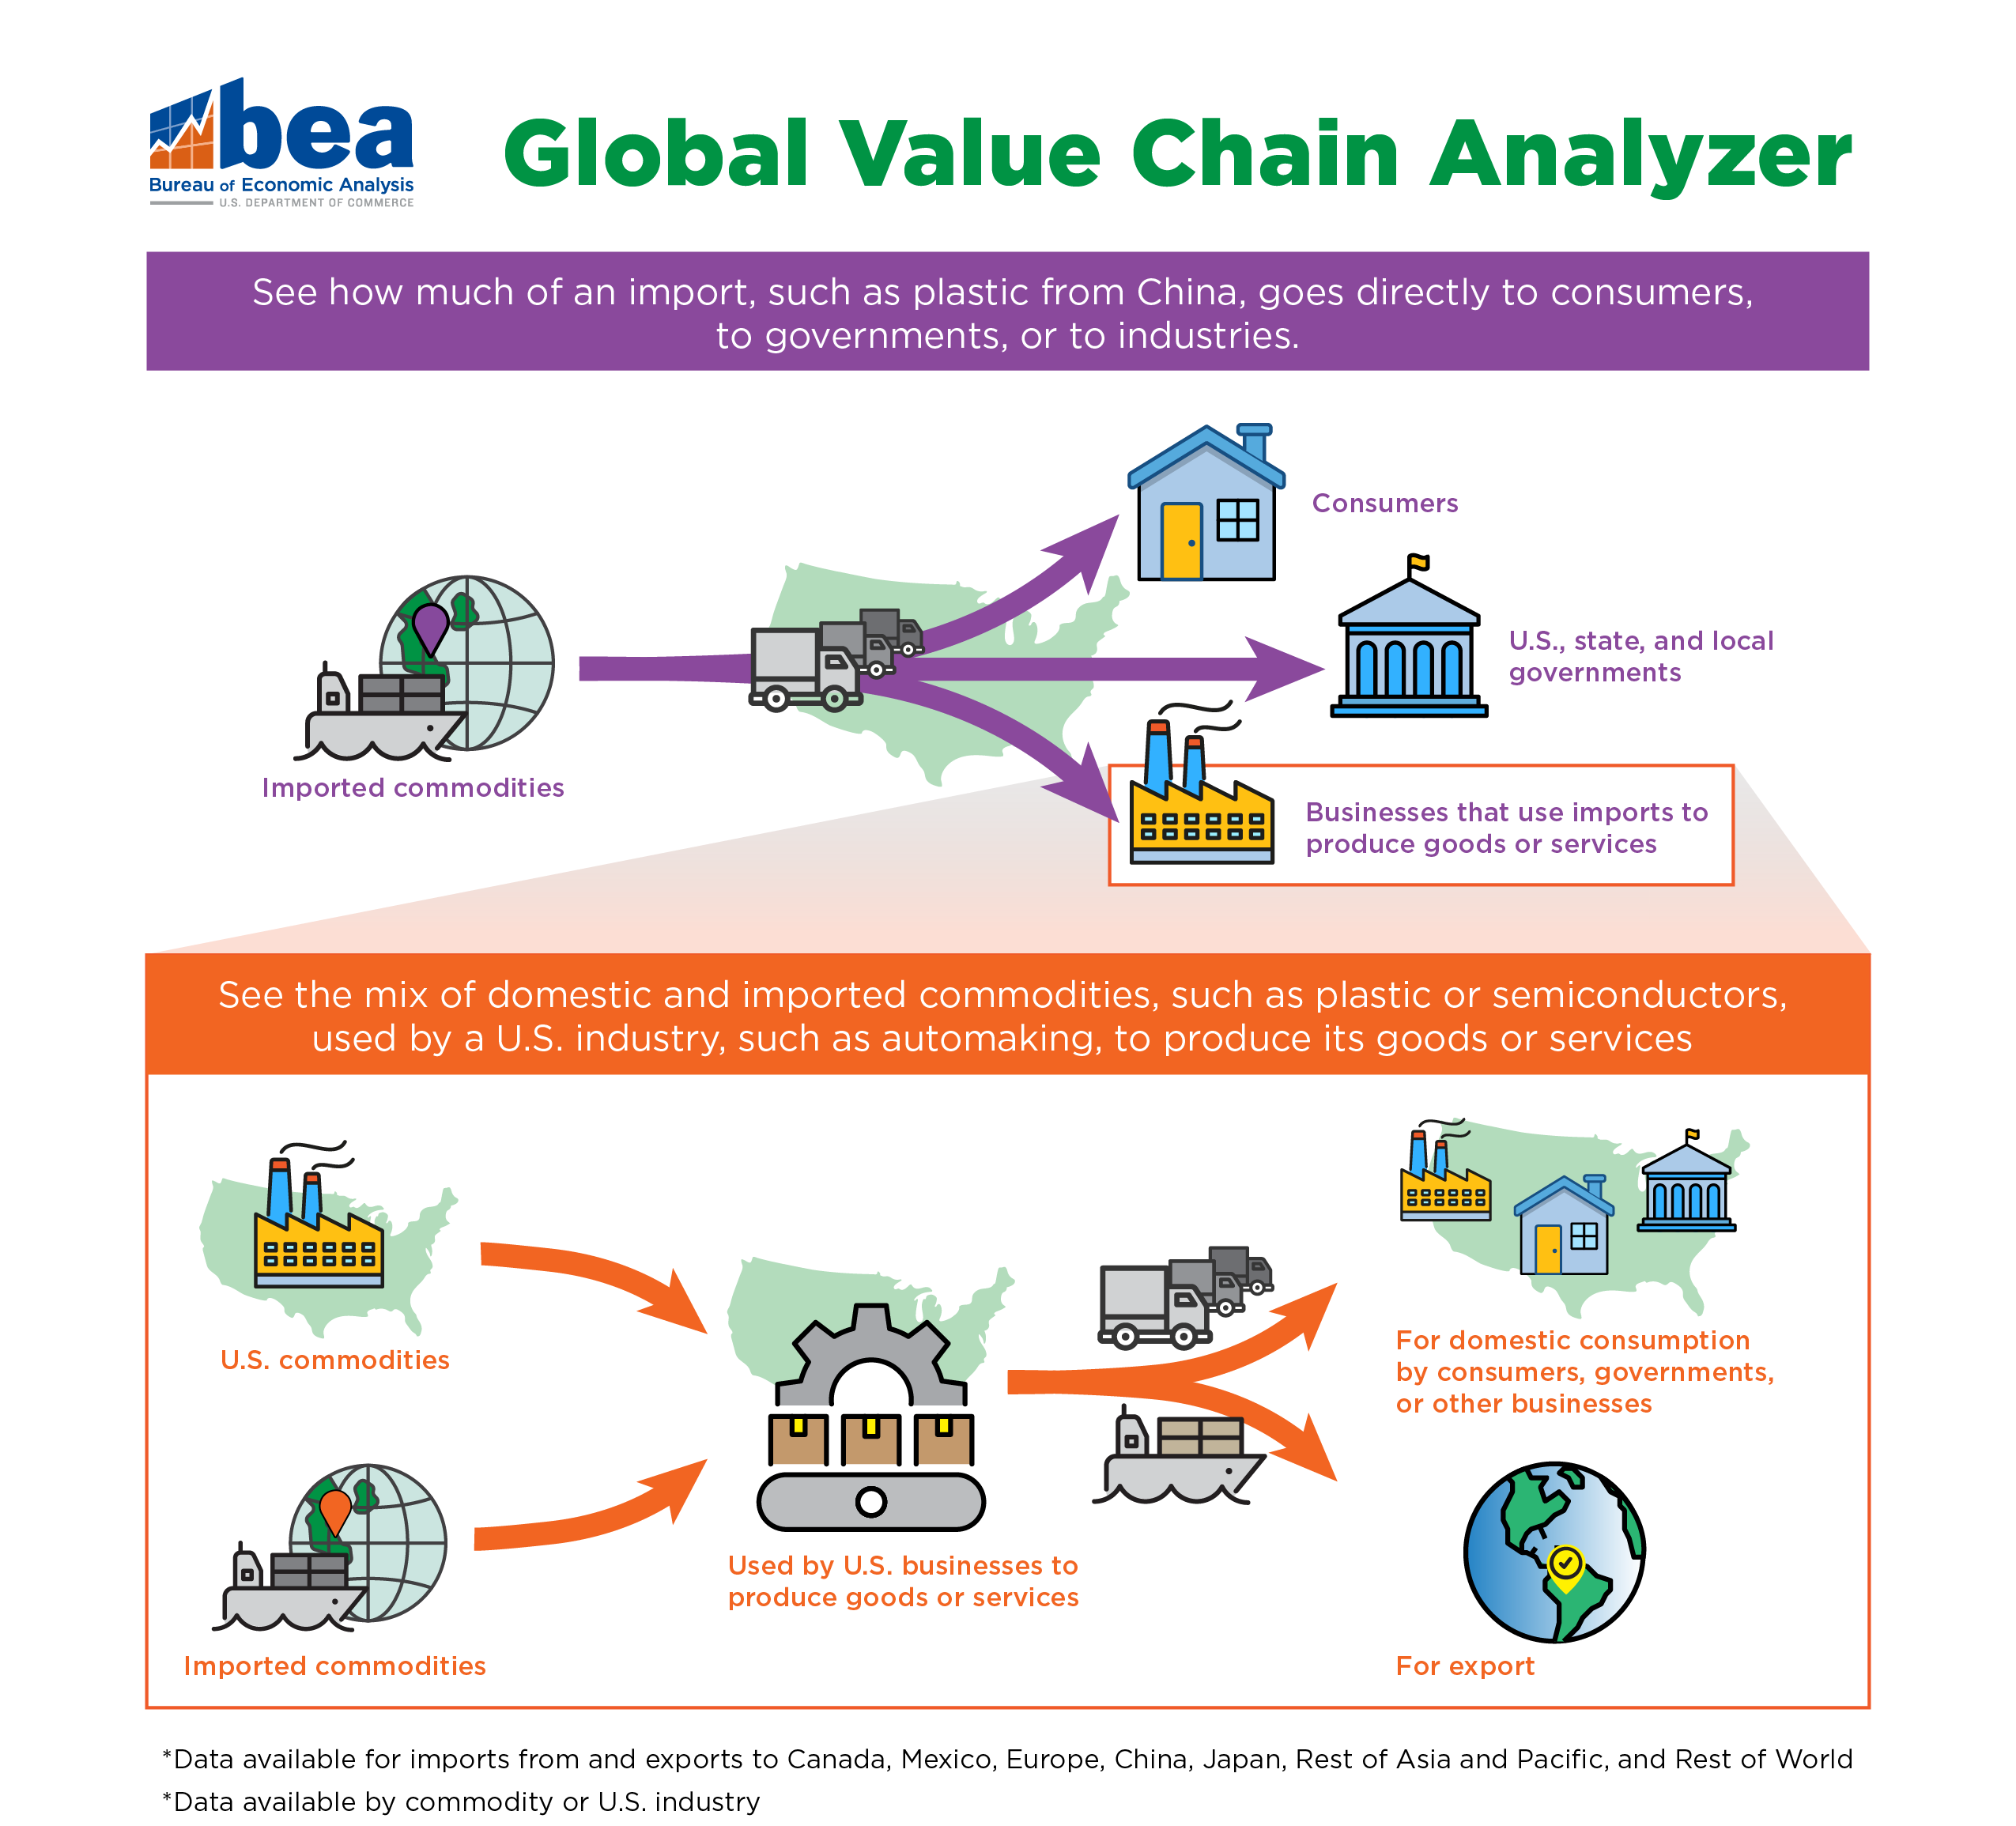
What Is the Global Value Chain Analyzer?
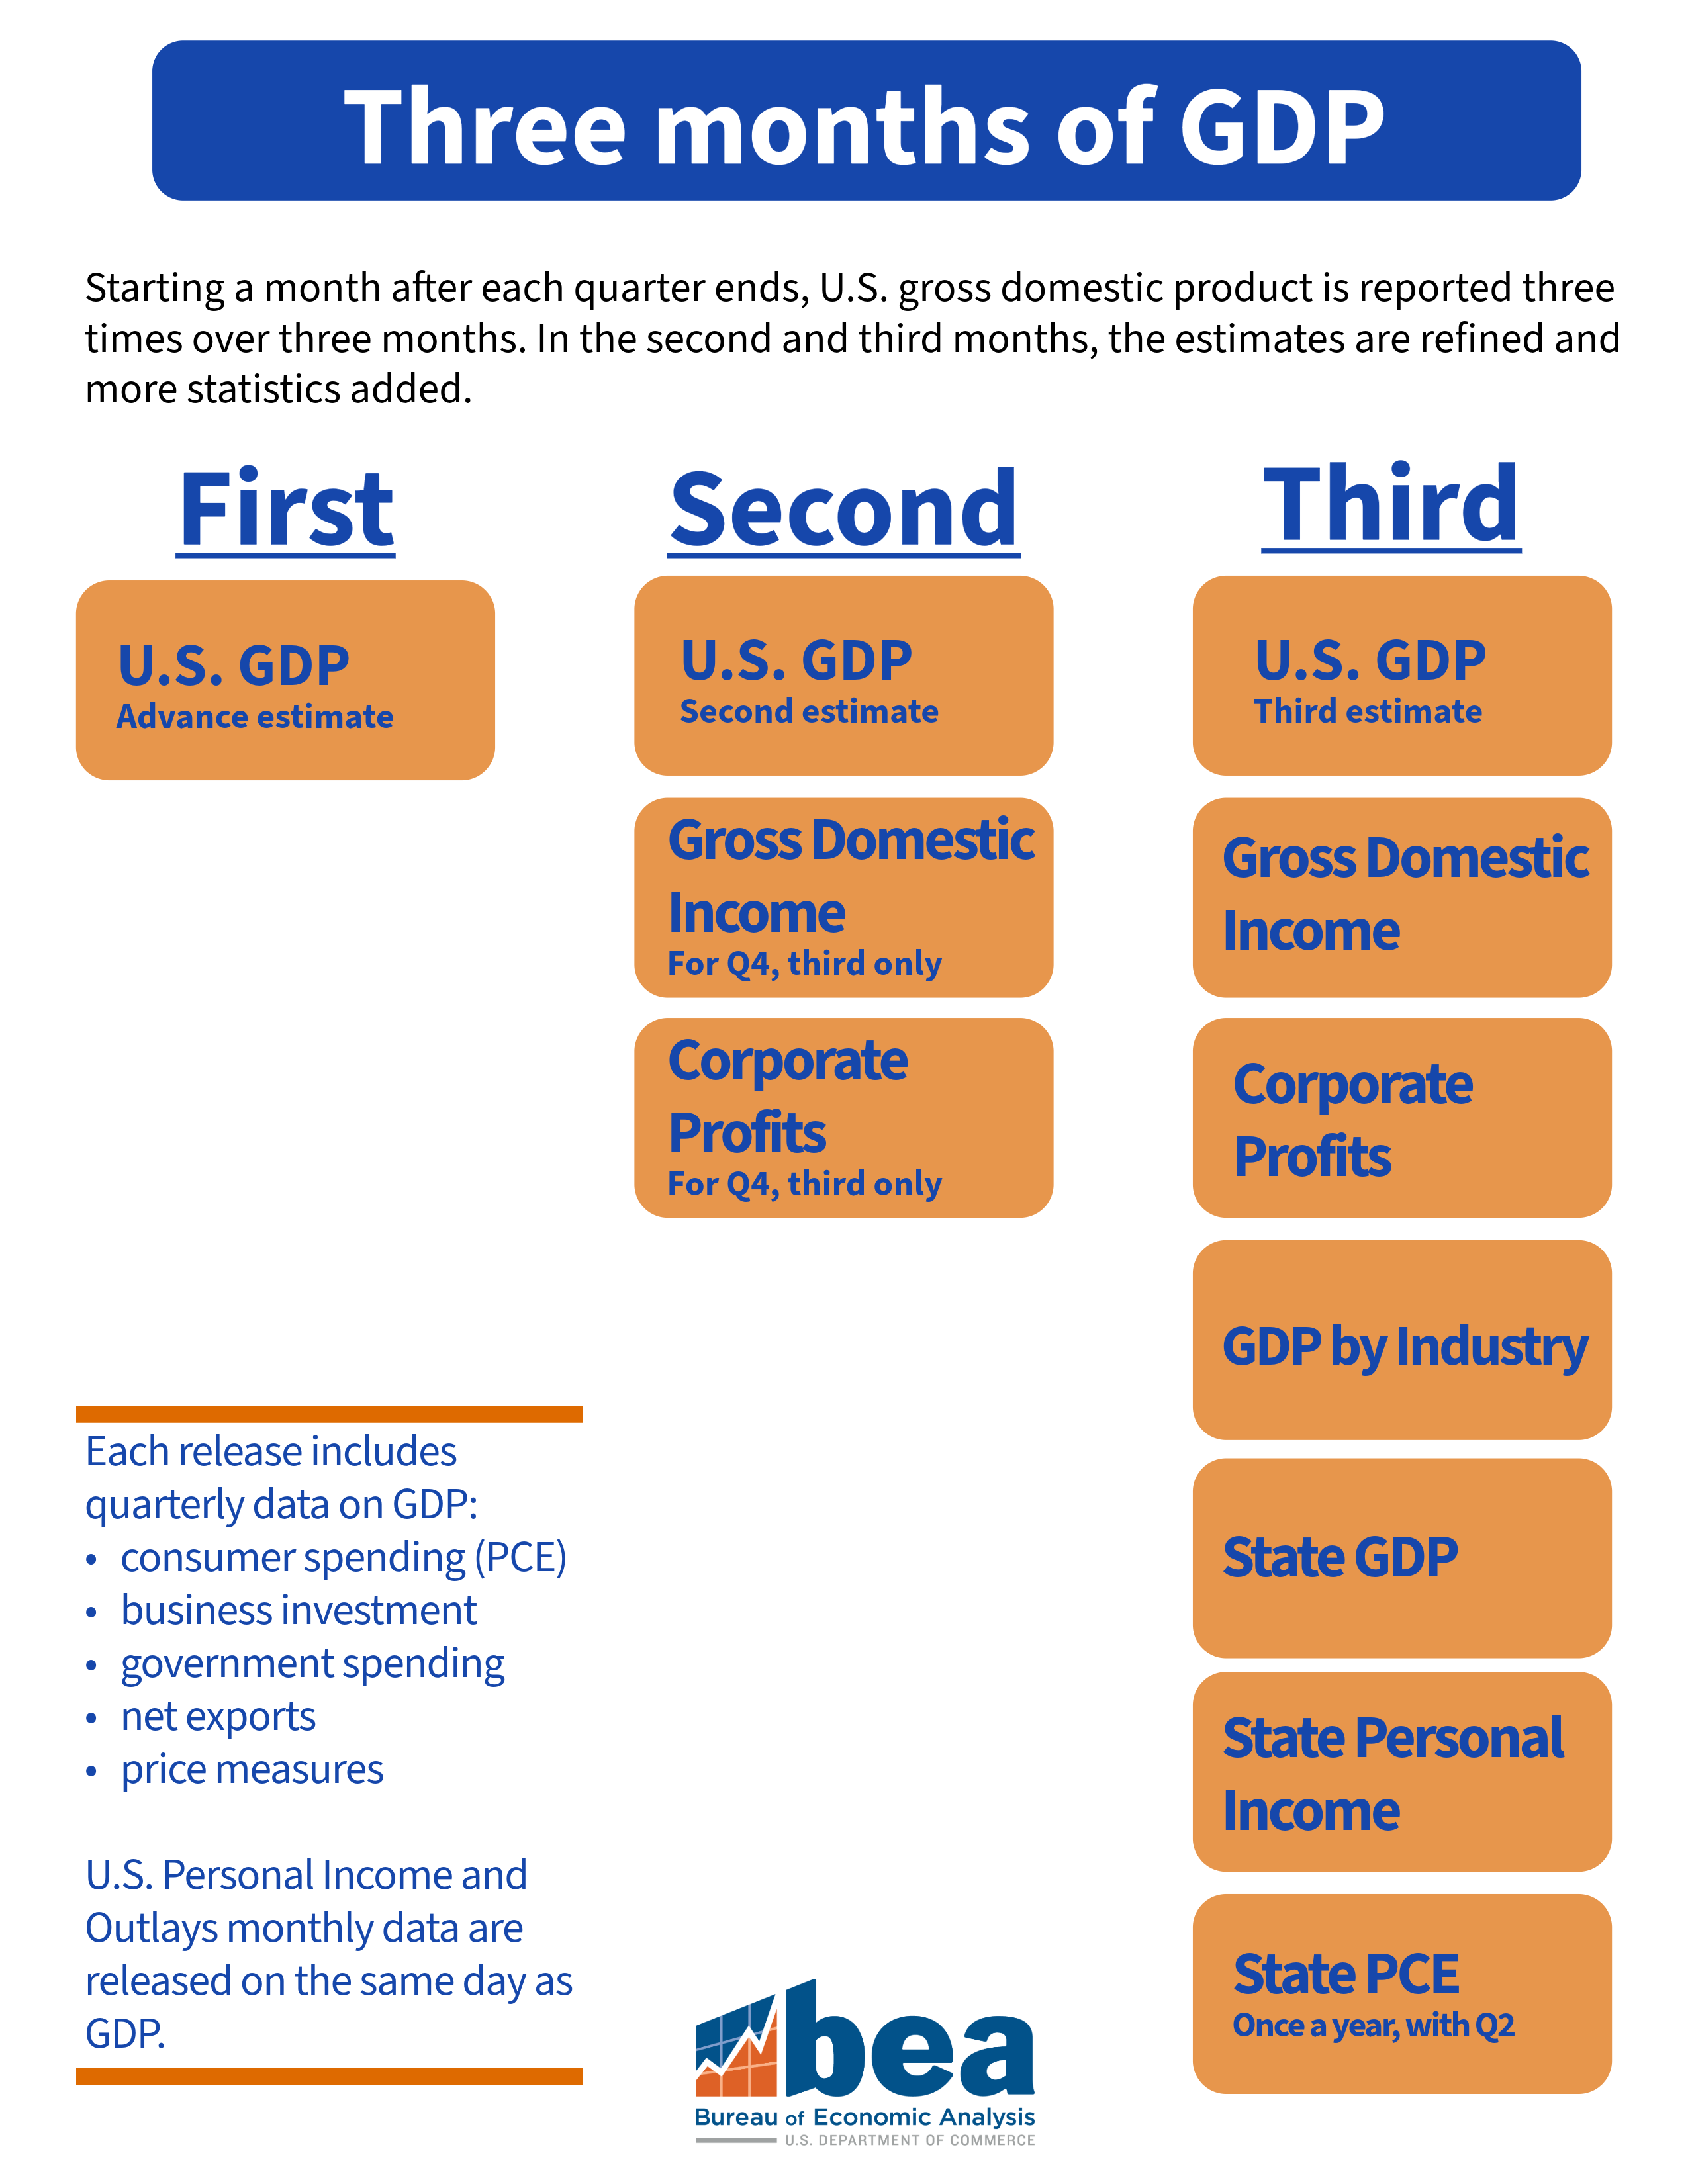
GDP by the Month
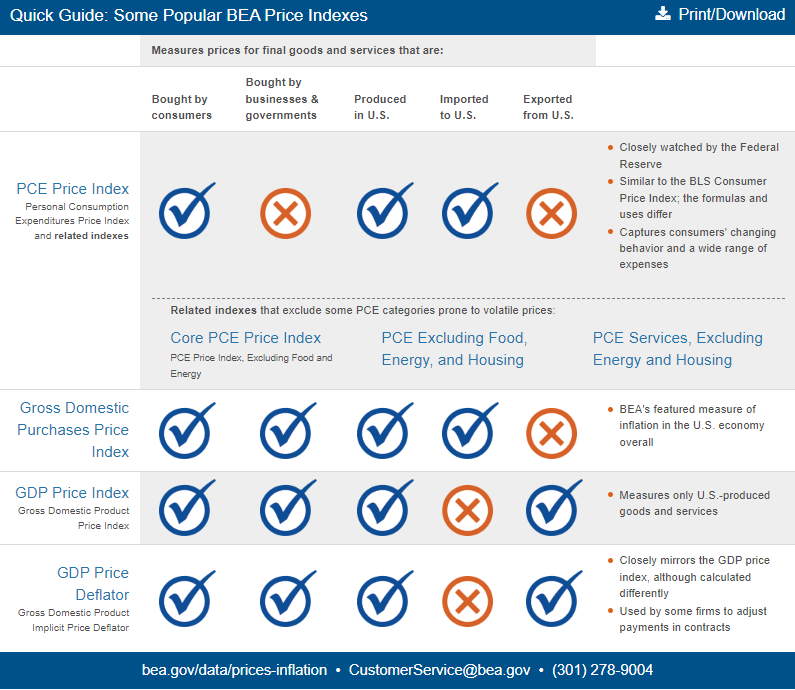
Quick Guide: Some Popular BEA Price Indexes
Filter by Multimedia Type:
- Any -
Audio
Video
Visual
Filter by Year:
- Any -
2026
2025
2024
2023
2022
2021
2020
2019
2018
2017
2016
Search by Keyword:
Apply
Reset
The Survey of New Foreign Direct Investment (BE-13)
May 2017
Spending on Travel and Tourism, 1999–2016
March 2017
U.S. Travel Imports in 2015
February 2017
Filing a BEA Survey: BE-13 Form Changes
February 2017
We've Got Your Number: Land lines vs Cell phones
February 2017
U.S. Travel Exports in 2015
January 2017
Health Care and Social Assistance Growth in Q2 2016
December 2016
Transportation and Warehousing Growth in Q2 2016
December 2016
Consumer Spending on Bakery Products
December 2016
Consumer Spending on Goods and Services in October
November 2016
Pagination
First page
« First
Previous page
‹ Previous
Page
1
Page
2
Page
3
Page
4
Page
5
Current page
6
Page
7
Page
8
Page
9
Next page
Next ›
Last page
Last »
Download Acrobat Reader
Page last modified on 7/24/26