BEA 25-27
Scheduled Date
June 30 08:30:am
Release Title
U.S. International Investment Position, 1st Quarter 2025 and Annual Update

An official website of the United States government
|
End of 2nd quarter 2024
|
-$22.52 trillion
|
|
End of 1st quarter 2024
|
-$21.29 trillion
|
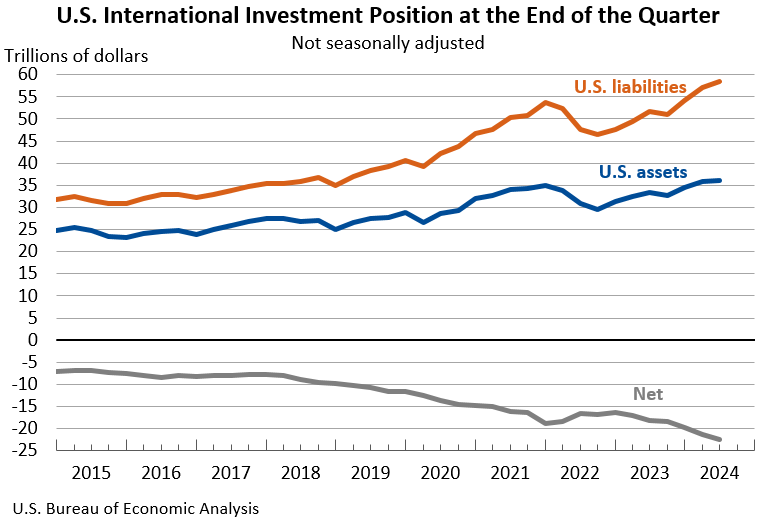
The U.S. net international investment position, the difference between U.S. residents’ foreign financial assets and liabilities, was -$22.52 trillion at the end of the second quarter of 2024, according to statistics released today by the U.S. Bureau of Economic Analysis. Assets totaled $36.00 trillion, and liabilities were $58.52 trillion. At the end of the first quarter, the net investment position was -$21.29 trillion (revised).
|
End of 1st quarter 2024
|
-$21.28 trillion
|
|
End of 4th quarter 2023
|
-$19.85 trillion
|
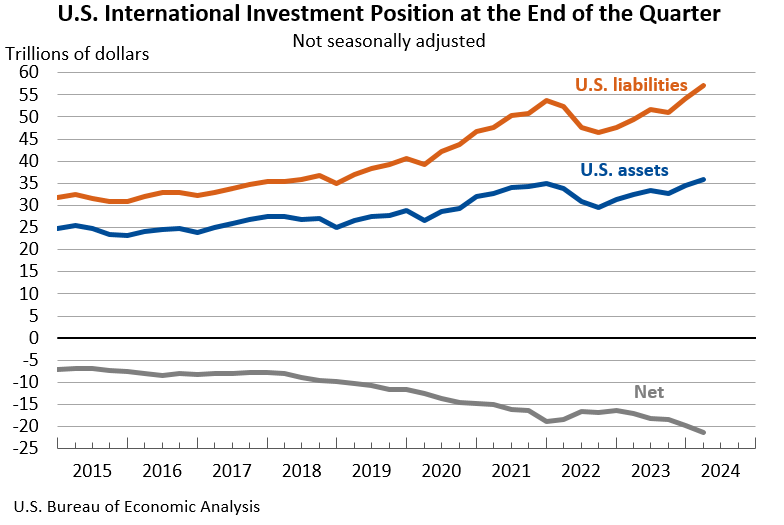
The U.S. net international investment position, the difference between U.S. residents’ foreign financial assets and liabilities, was -$21.28 trillion at the end of the first quarter of 2024, according to statistics released today by the U.S. Bureau of Economic Analysis (BEA). Assets totaled $35.78 trillion, and liabilities were $57.06 trillion. At the end of the fourth quarter of 2023, the net investment position was -$19.85 trillion (revised).
|
End of 4th quarter 2023:
|
-$19.77 trillion
|
|
End of 3rd quarter 2023:
|
-$18.11 trillion
|
|
End of year 2023:
|
-$19.77 trillion
|
|
End of year 2022:
|
-$16.17 trillion
|
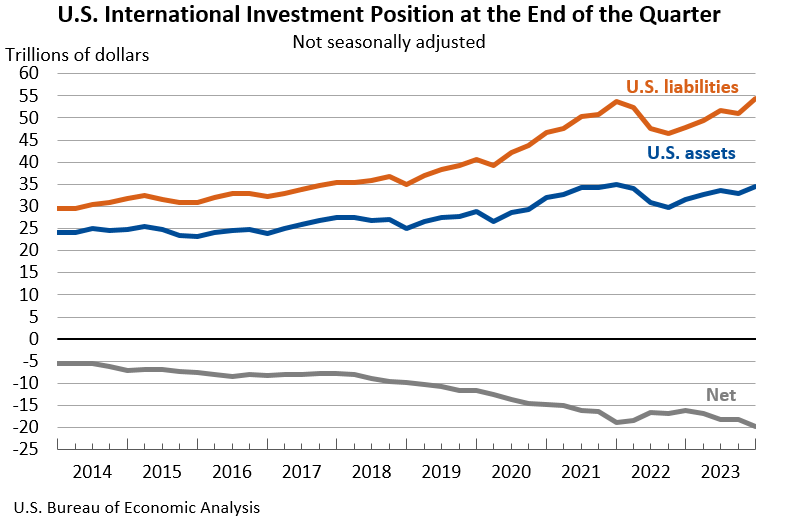
The U.S. net international investment position, the difference between U.S. residents’ foreign financial assets and liabilities, was -$19.77 trillion at the end of the fourth quarter of 2023, according to statistics released today by the U.S. Bureau of Economic Analysis (BEA). Assets totaled $34.54 trillion, and liabilities were $54.31 trillion. At the end of the third quarter, the net investment position was -$18.11 trillion (revised).
|
End of 3rd quarter 2023:
|
-$18.16 trillion
|
|
End of 2nd quarter 2023:
|
-$18.14 trillion
|
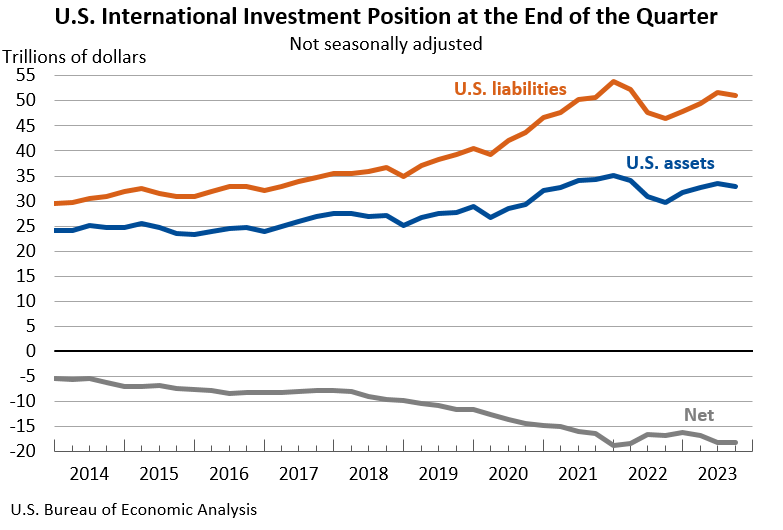
The U.S. net international investment position, the difference between U.S. residents’ foreign financial assets and liabilities, was -$18.16 trillion at the end of the third quarter of 2023, according to statistics released today by the U.S. Bureau of Economic Analysis (BEA). Assets totaled $32.91 trillion, and liabilities were $51.07 trillion. At the end of the second quarter, the net investment position was -$18.14 trillion (revised).