
News Release
U.S. International Investment Position, 1st Quarter 2023 and Annual Update
First Quarter
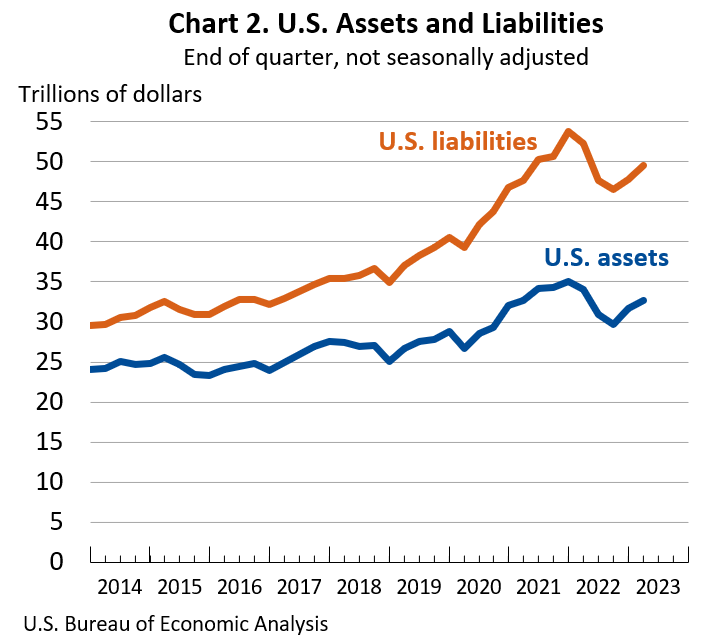
The U.S. net international investment position, the difference between U.S. residents’ foreign financial assets and liabilities, was –$16.75 trillion at the end of the first quarter of 2023, according to statistics released today by the U.S. Bureau of Economic Analysis (BEA). Assets totaled $32.74 trillion, and liabilities were $49.49 trillion. At the end of the fourth quarter of 2022, the net investment position was –$16.17 trillion (revised). The net investment position and components of assets and liabilities are presented in table 1.
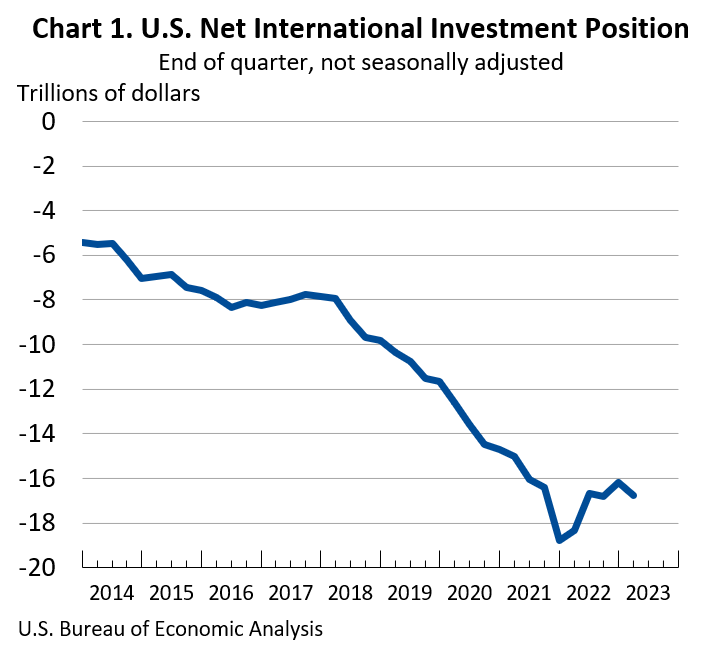
The –$577.9 billion change in the net investment position from the fourth quarter to the first quarter came from net financial transactions of –$307.9 billion and net other changes in position, such as price and exchange-rate changes, of –$270.1 billion. Net other changes mostly reflected U.S. stock price increases that exceeded foreign stock price increases (table A).
Table A. Quarterly Change in the U.S. Net International Investment Position
[Billions of dollars, not seasonally adjusted]
| End of quarter position, 2022:Q4 |
Change in position in 2023:Q1 | End of quarter position, 2023:Q1 |
|||
| Total | Attributable to: | ||||
| Financial transactions |
Other changes in position 1 |
||||
| U.S. net international investment position | –16,172.3 | –577.9 | –307.9 | –270.1 | –16,750.2 |
| Net position excluding financial derivatives | –16,241.8 | –550.8 | –306.1 | –244.7 | –16,792.6 |
| Financial derivatives other than reserves, net | 69.5 | –27.1 | –1.7 | –25.4 | 42.4 |
| U.S. assets | 31,631.8 | 1,109.3 | (2) | (2) | 32,741.1 |
| Assets excluding financial derivatives | 29,088.5 | 1,459.5 | –41.1 | 1,500.5 | 30,548.0 |
| Financial derivatives other than reserves | 2,543.3 | –350.2 | (2) | (2) | 2,193.1 |
| U.S. liabilities | 47,804.1 | 1,687.2 | (2) | (2) | 49,491.3 |
| Liabilities excluding financial derivatives | 45,330.3 | 2,010.3 | 265.1 | 1,745.2 | 47,340.6 |
| Financial derivatives other than reserves | 2,473.8 | –323.1 | (2) | (2) | 2,150.7 |
|
1. Disaggregation of other changes in position into price changes, exchange-rate changes, and other changes in volume and valuation is presented for annual statistics released in March and revised in June each year. |
|||||
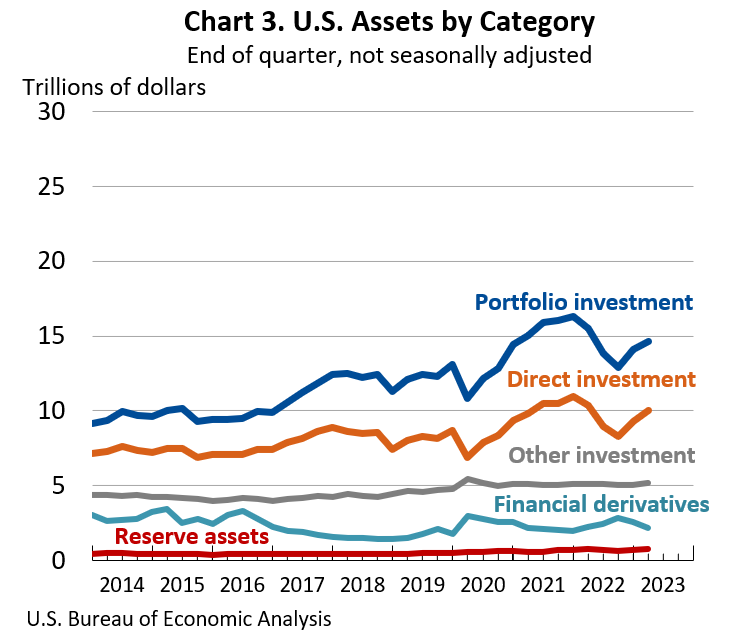
U.S. assets increased by $1.11 trillion to a total of $32.74 trillion at the end of the first quarter, mostly reflecting increases in direct investment and portfolio investment assets that were partly offset by a decrease in financial derivatives.
Direct investment assets increased by $716.8 billion to $9.99 trillion and portfolio investment assets increased by $583.1 billion to $14.66 trillion, driven mainly by foreign stock price increases that raised the market value of these assets. Financial derivatives decreased by $350.2 billion to $2.19 trillion, driven by decreases in single-currency interest rate contracts and foreign exchange contracts.
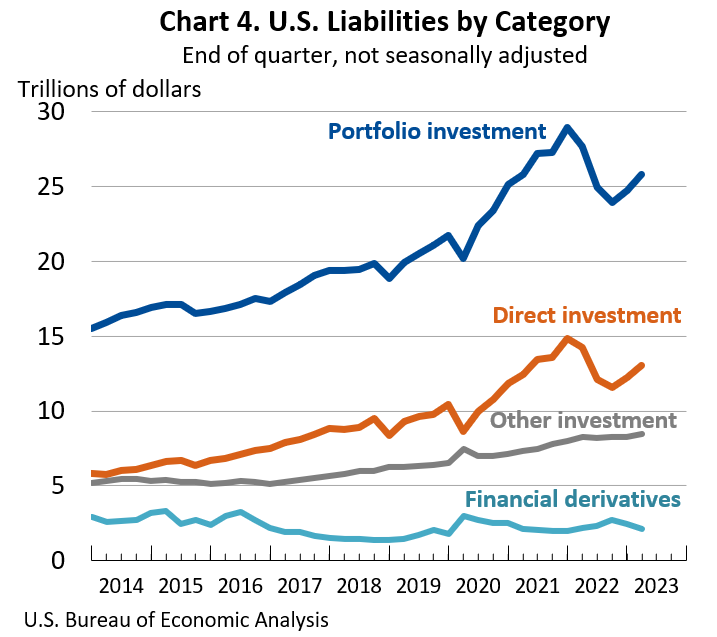
U.S. liabilities increased by $1.69 trillion to a total of $49.49 trillion at the end of the first quarter, mostly reflecting increases in portfolio investment and direct investment liabilities that were partly offset by a decrease in financial derivatives.
Portfolio investment liabilities increased by $1.09 trillion to $25.85 trillion and direct investment liabilities increased by $771.6 billion to $13.03 trillion, driven mainly by U.S. stock price increases that raised the market value of these liabilities. Financial derivatives decreased by $323.1 billion to $2.15 trillion, driven by decreases in single-currency interest rate contracts and foreign exchange contracts.
Annual Update of the U.S. International Investment Position Accounts
The statistics in this release reflect the annual update of the U.S. International Investment Position Accounts. With this update, BEA has incorporated newly available and revised source data for 2019–2022 (table 2).
Newly Available and Revised Source Data: Key Providers and Years Affected
| Agency | Data | Years affected |
| U.S. Bureau of Economic Analysis | Benchmark, annual, and quarterly direct investment surveys (direct investment and other investment assets and liabilities) | 2019–2022 |
| U.S. Department of the Treasury | Aggregate Holdings, Purchases and Sales, and Fair Value Changes of Long-Term Securities by U.S. and Foreign Residents (portfolio investment assets and liabilities) Note: The revision to portfolio investment liabilities at the end of 2021 (shown in table 2), which also affects the net investment position, reflects a significant series break from this data source. | 2021–2022 |
| Foreign-Residents’ Holdings of U.S. Securities, including Selected Money Market Instruments (portfolio investment liabilities) | 2022 | |
| U.S. Ownership of Foreign Securities, including Selected Money Market Instruments (portfolio investment assets) | 2021 | |
| Reports by Financial Institutions of Liabilities to, and Claims on, Foreign Residents by U.S. Residents (portfolio investment and other investment assets and liabilities) | 2020–2022 | |
| Reports of Liabilities to, and Claims on, Unaffiliated Foreign Residents by U.S. Resident Non-Financial Institutions (portfolio investment and other investment assets and liabilities) | 2021–2022 | |
| Reports of Holdings of, and Transactions in, Financial Derivatives Contracts with Foreign Residents (financial derivatives assets and liabilities) | 2021–2022 |
More information on the annual update is available in “Preview of the 2023 Annual Update of the International Economic Accounts” in the Survey of Current Business, and additional information will be published in July in the Survey.
Next release: September 27, 2023, at 8:30 a.m. EDT
U.S. International Investment Position, 2nd Quarter 2023