Which Census Bureau population estimates does BEA use in the calculation of state and county per capita personal income statistics?

BEA uses Census Bureau midyear (July 1) resident population estimates for states and counties to calculate per capita personal income estimates. Each new series of data (called vintages) incorporates the latest administrative record data, geographic boundaries, and methodology. Therefore, the entire time series of estimates beginning with the most recent decennial census is revised annually.

What is the impact of COVID-19 on the State Personal Income statistics for 2020 Q1?

The 2020 Q1 estimates of State Personal Income were impacted by the response to the spread of COVID-19, as governments issued “stay-at-home” orders. This led to rapid changes in employment and earnings as businesses switched to remote work or canceled operations, and consumers canceled, restricted, or redirected their spending.

Why are the 1997 estimates of GDP by state different for SIC and NAICS?

There are several differences between the SIC and NAICS estimates, which may affect the industry estimates as well as the state totals. First, these are two different industry classifications, and as such, industries classified in one sector on SIC may be classified in another sector on NAICS. Second, the data sources and estimation methods used for NAICS may differ from those used to produce the SIC estimates. Finally, the NAICS-based estimates are consistent with national GDP while the SIC-based estimates are consistent with national gross domestic income (GDI).

How is a metropolitan area defined?

The U.S. Office of Management and Budget defines metropolitan [statistical] areas as standardized county or equivalent-based areas having at least one urbanized area of 50,000 or more population, plus adjacent territory that has a high degree of social and economic integration with the core, as measured by commuting ties. For more information on how metropolitan areas are defined, see http://www.census.gov/population/www/estimates/metroarea.html.

What is the definition of the earnings data used in the calculation of GDP by metropolitan area?

The county earnings data used for the estimation of GDP by metropolitan area are from BEA’s local area personal income accounts (available at www.bea.gov/iTable/iTable.cfm?reqid=70&step=1&isuri=1&acrdn=5#reqid=70&step=1&isuri=1). Earnings by place of work is the sum of wage and salary disbursements, supplements to wages and salaries, and proprietors' income.

Why does the GDP produced in small metropolitan areas tend to grow faster than GDP produced in large metropolitan areas?

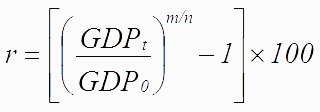
Growth rates measure the increase in GDP over a given time period as a ratio of GDP for the first year of the time period. Therefore, a modest increase in the GDP of a small MSA will indicate a fast growth rate because the denominator of the ratio is small. For example, assume two metropolitan areas experienced the same amount of growth in dollars and that one area is significantly smaller than the other. In the formula below to compute percent change, the numerator (the amount of growth) will be the same for both areas.