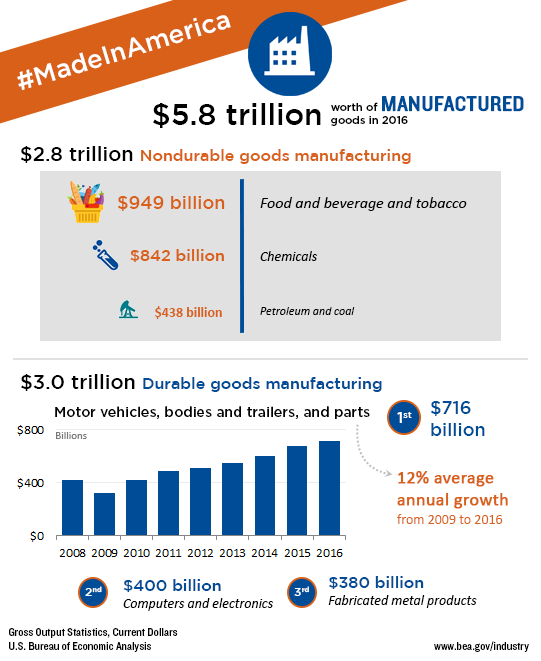
Made in America: Manufacturing Infographic Read more about Made in America: Manufacturing Infographic Source Data
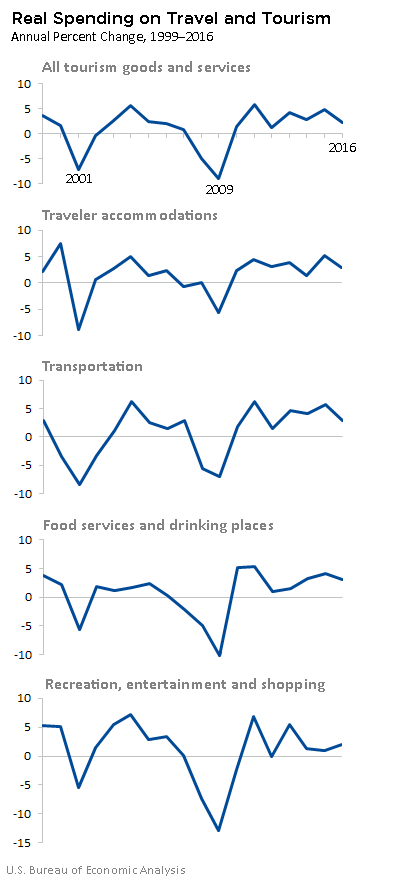
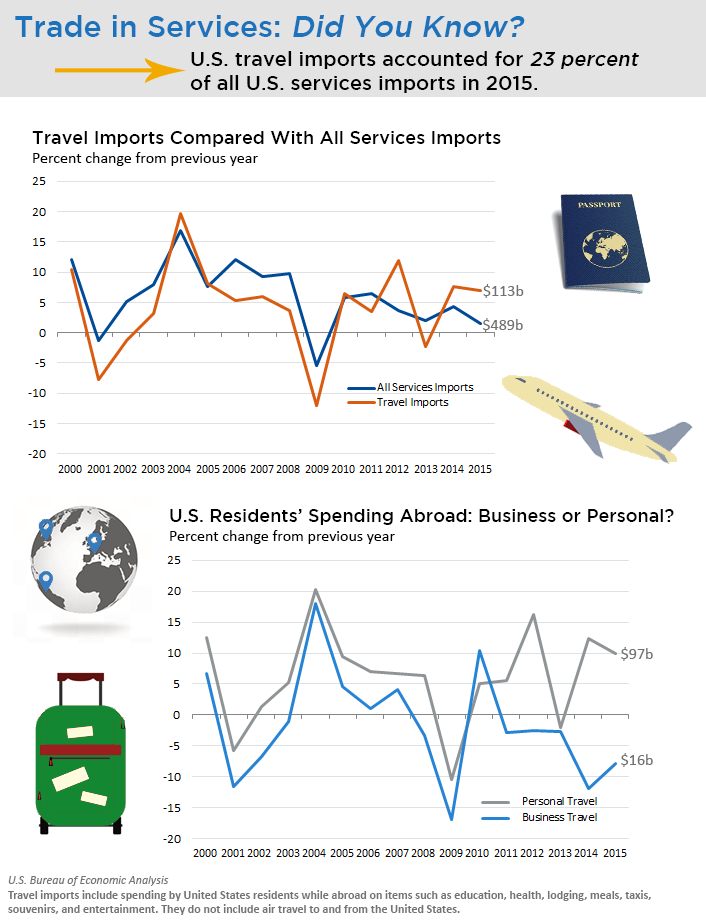
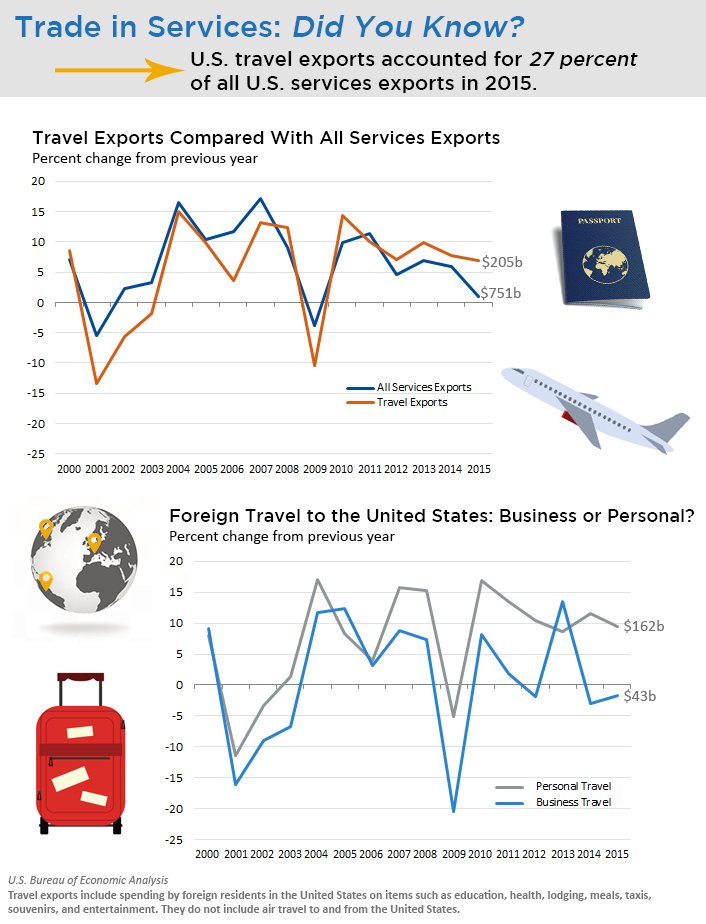
Spending on Travel and Tourism, 1999–2016 Read more about Spending on Travel and Tourism, 1999–2016 Source Data
Health Care and Social Assistance Growth in Q2 2016 Read more about Health Care and Social Assistance Growth in Q2 2016 Source Data
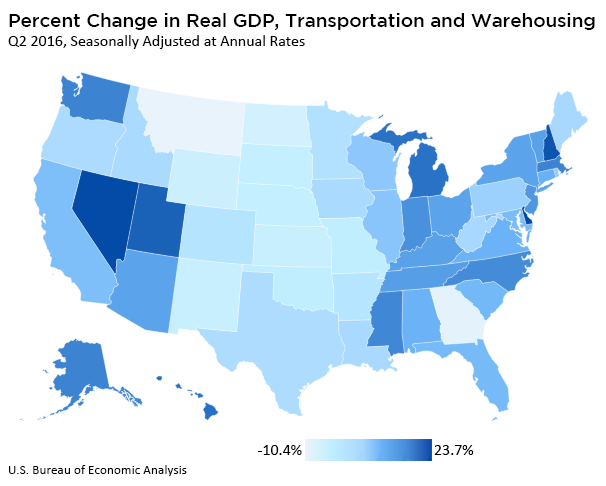
Transportation and Warehousing Growth in Q2 2016 Read more about Transportation and Warehousing Growth in Q2 2016 Source Data
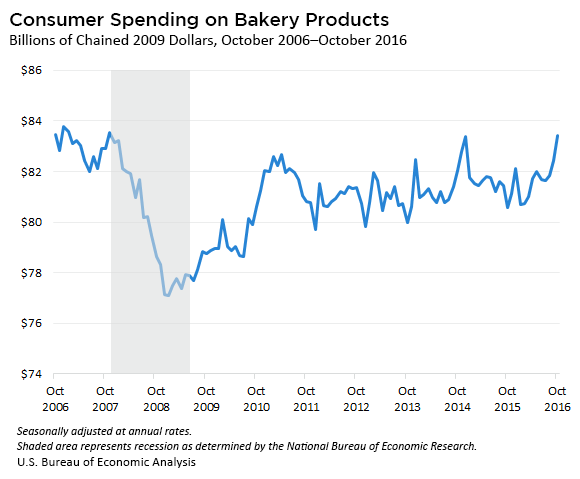
Consumer Spending on Bakery Products Read more about Consumer Spending on Bakery Products Source Data
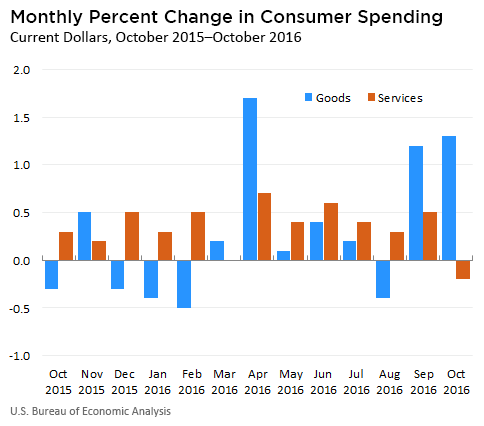
Consumer Spending on Goods and Services in October Read more about Consumer Spending on Goods and Services in October Source Data
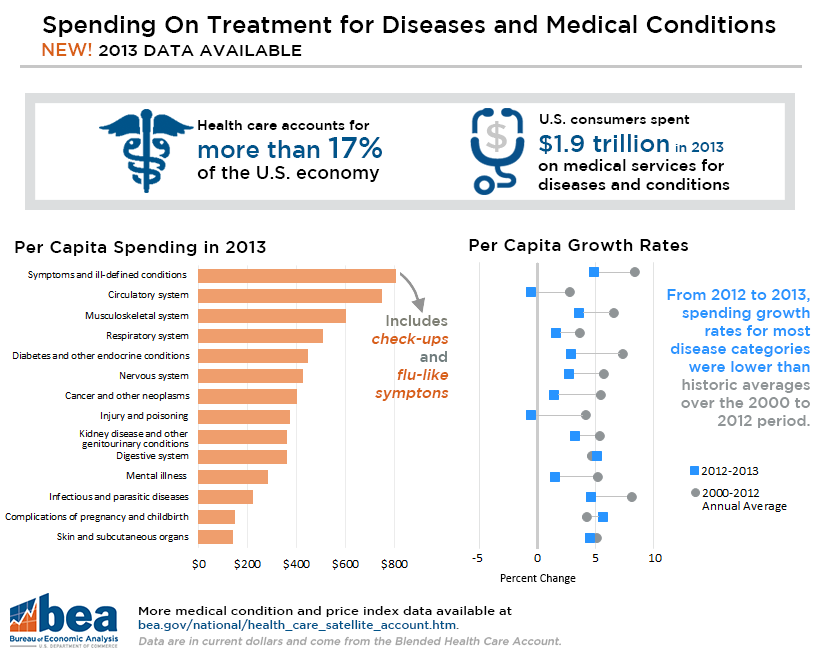
Infographic: Spending on Treatment for Diseases and Medical Conditions in 2013 Read more about Infographic: Spending on Treatment for Diseases and Medical Conditions in 2013
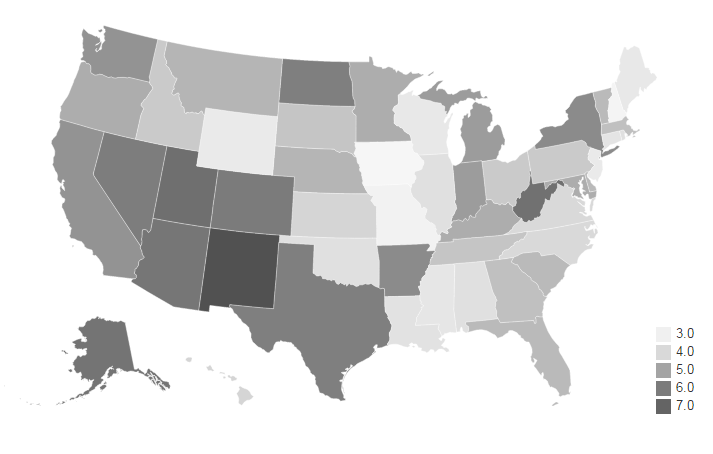
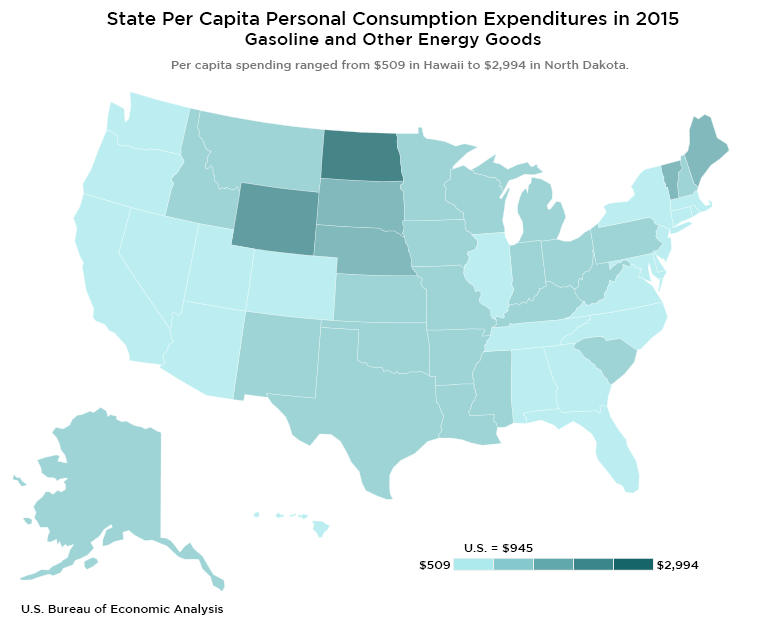
State Per Capita Consumer Spending on Gasoline and Other Energy Goods Read more about State Per Capita Consumer Spending on Gasoline and Other Energy Goods Source Data