BEA 26-25
Scheduled Date
July 21 08:30:am
Release Title
Direct Investment by Country and Industry, 2025

An official website of the United States government
The U.S. direct investment abroad position, or cumulative level of investment, increased $206.3 billion to $6.83 trillion at the end of 2024, according to statistics released today by the U.S. Bureau of Economic Analysis. The increase was led by an $88.4 billion increase in the position in Europe, primarily in Luxembourg and Germany. By industry, manufacturing affiliates had the largest increase, led by manufacturing of computers and electronic products.
The foreign direct investment in the United States position increased $332.1 billion to $5.71 trillion at the end of 2024. The increase was led by a $204.7 billion increase in the position from Europe, which reflected a $52.9 billion increase from the United Kingdom and a $39.7 billion increase from Germany. By industry, affiliates in manufacturing increased the most.
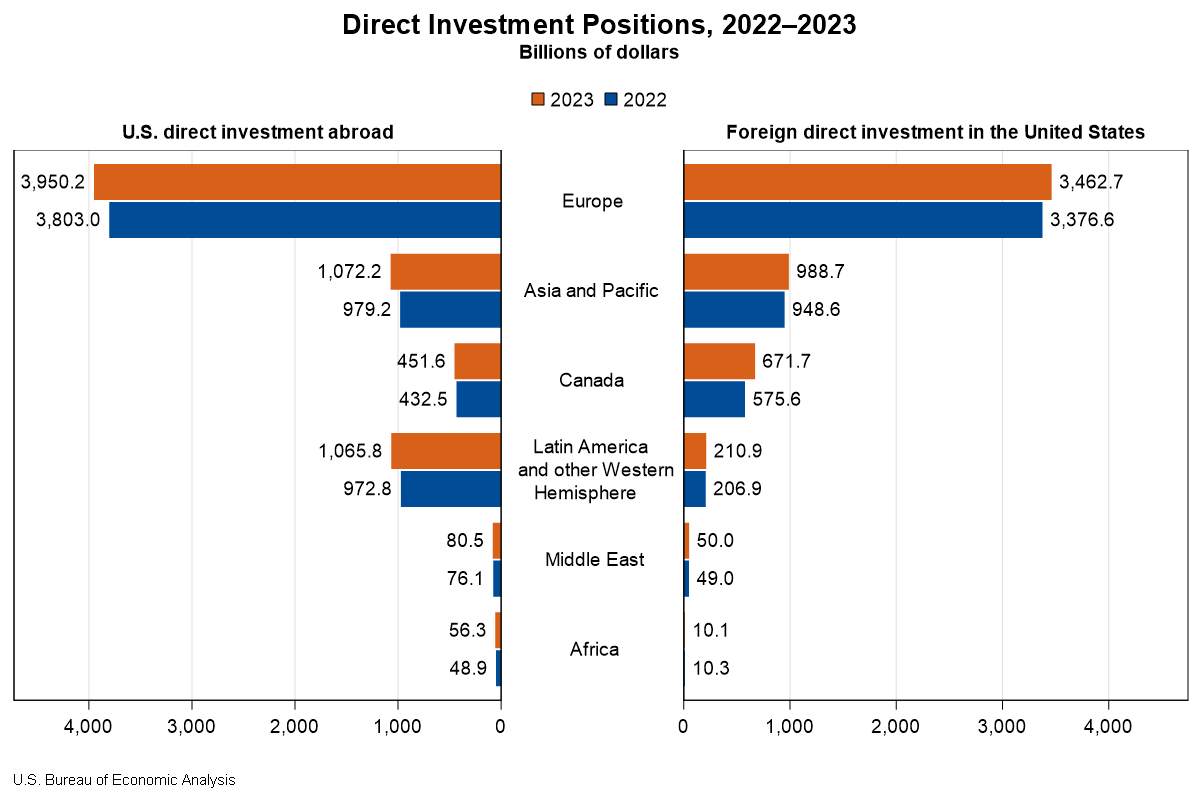
The U.S. direct investment abroad position, or cumulative level of investment, increased $364.0 billion to $6.68 trillion at the end of 2023, according to statistics released today by the U.S. Bureau of Economic Analysis. The increase reflected a $147.1 billion increase in the position in Europe (chart 1), primarily in Ireland, Switzerland, and the Netherlands. By industry, holding company affiliates had the largest increase.
The foreign direct investment in the United States position increased $227.0 billion to $5.39 trillion at the end of 2023. The increase mainly reflected a $96.0 billion increase in the position from Canada and an $86.1 billion increase from Europe, primarily a $58.9 billion increase from Germany. By industry, affiliates in manufacturing increased the most, increasing $58.6 billion to a total investment position of $2.22 trillion.
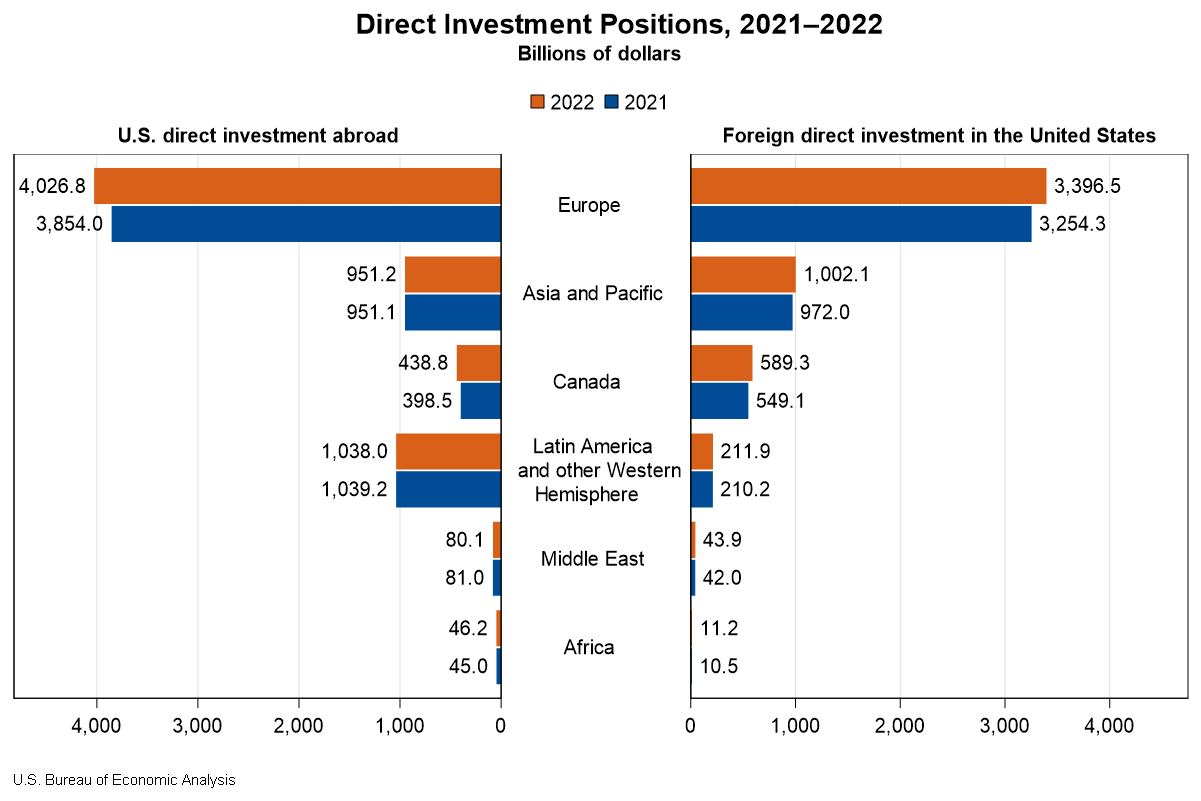
The U.S. direct investment abroad position, or cumulative level of investment, increased $212.2 billion to $6.58 trillion at the end of 2022 from $6.37 trillion at the end of 2021, according to statistics released today by the U.S. Bureau of Economic Analysis. The increase reflected a $172.8 billion increase in the position in Europe, primarily in the Netherlands and the United Kingdom. By industry, manufacturing affiliates had the largest increase.
The foreign direct investment in the United States position increased $216.8 billion to $5.25 trillion at the end of 2022 from $5.04 trillion at the end of 2021. The increase mainly reflected a $142.2 billion increase in the position from Europe, with the largest increases from the United Kingdom and Germany. By industry, affiliates in manufacturing and wholesale trade accounted for the majority of the increase.
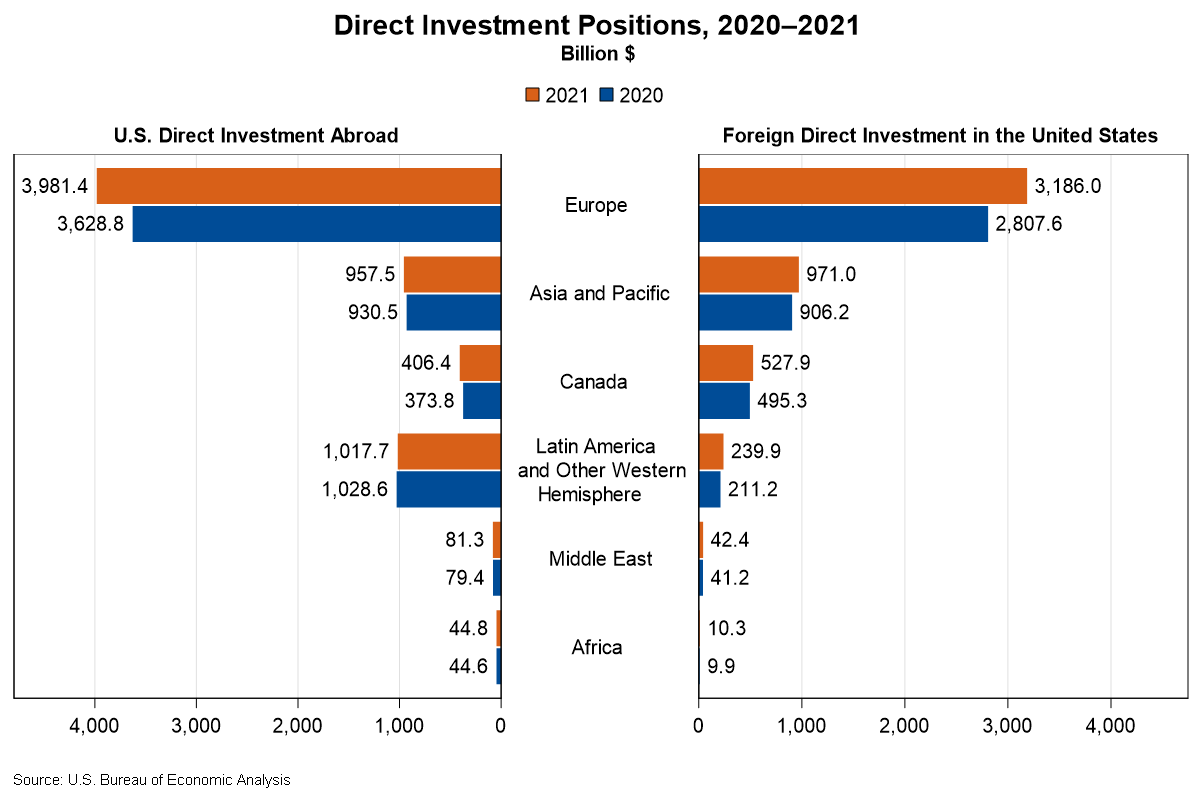
The U.S. direct investment abroad position, or cumulative level of investment, increased $403.3 billion to $6.49 trillion at the end of 2021 from $6.09 trillion at the end of 2020, according to statistics released today by the U.S. Bureau of Economic Analysis (BEA). The increase reflected a $352.6 billion increase in the position in Europe, primarily in Ireland and the United Kingdom. By industry, holding company affiliates owned by U.S. manufacturers had the largest increase.
The foreign direct investment in the United States position increased $506.1 billion to $4.98 trillion at the end of 2021 from $4.47 trillion at the end of 2020. The increase mainly reflected a $378.4 billion increase in the position from Europe, primarily the Netherlands and the United Kingdom. By industry, affiliates in manufacturing and information accounted for the majority of the increase.
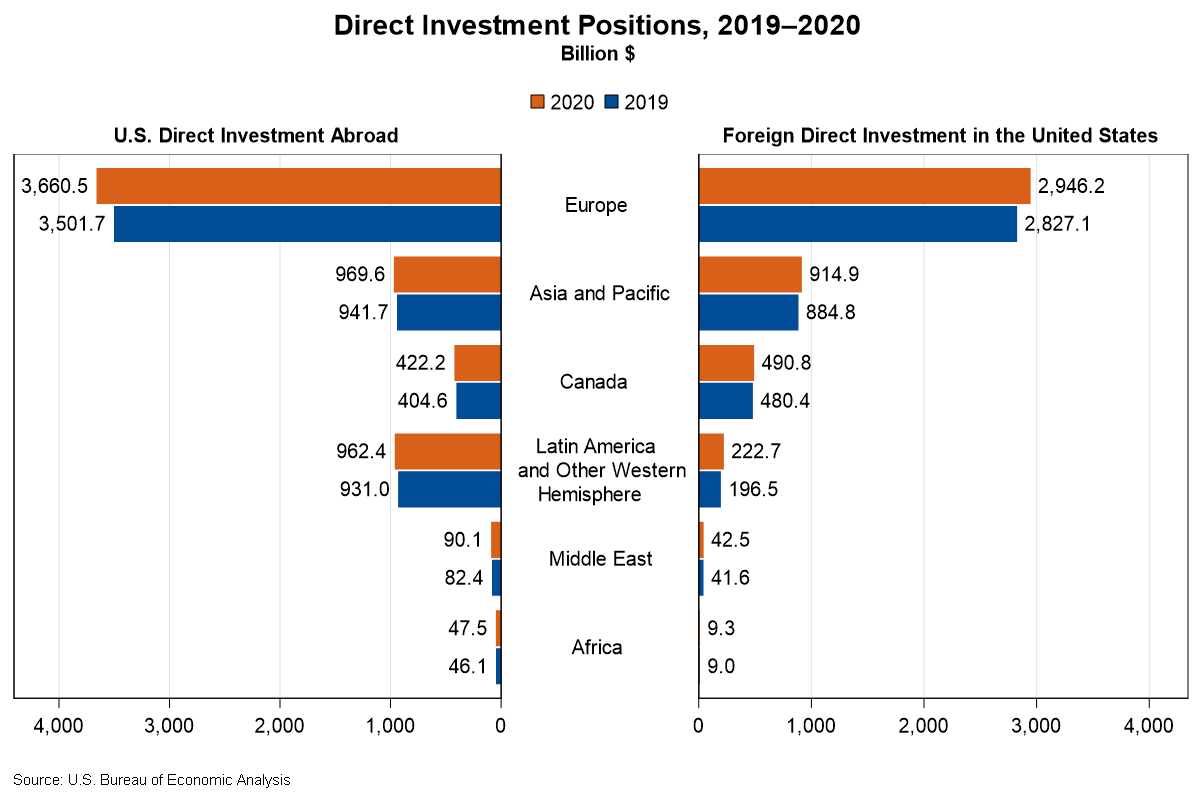
The U.S. direct investment abroad position, or cumulative level of investment, increased $244.9 billion to $6.15 trillion at the end of 2020 from $5.91 trillion at the end of 2019, according to statistics released by the Bureau of Economic Analysis (BEA). The increase reflected a $158.8 billion increase in the position in Europe, primarily in the United Kingdom and the Netherlands. By industry, holding company affiliates owned by U.S. manufacturers had the largest increase.
The foreign direct investment in the United States position increased $187.2 billion to $4.63 trillion at the end of 2020 from $4.44 trillion at the end of 2019. The increase mainly reflected a $119.2 billion increase in the position from Europe, primarily Germany. By industry, affiliates in manufacturing, finance and insurance, and wholesale trade accounted for the majority of the increase.