BEA 20-36
Scheduled Date
July 23 08:30:am
Release Title
Direct Investment by Country and Industry, 2019

An official website of the United States government
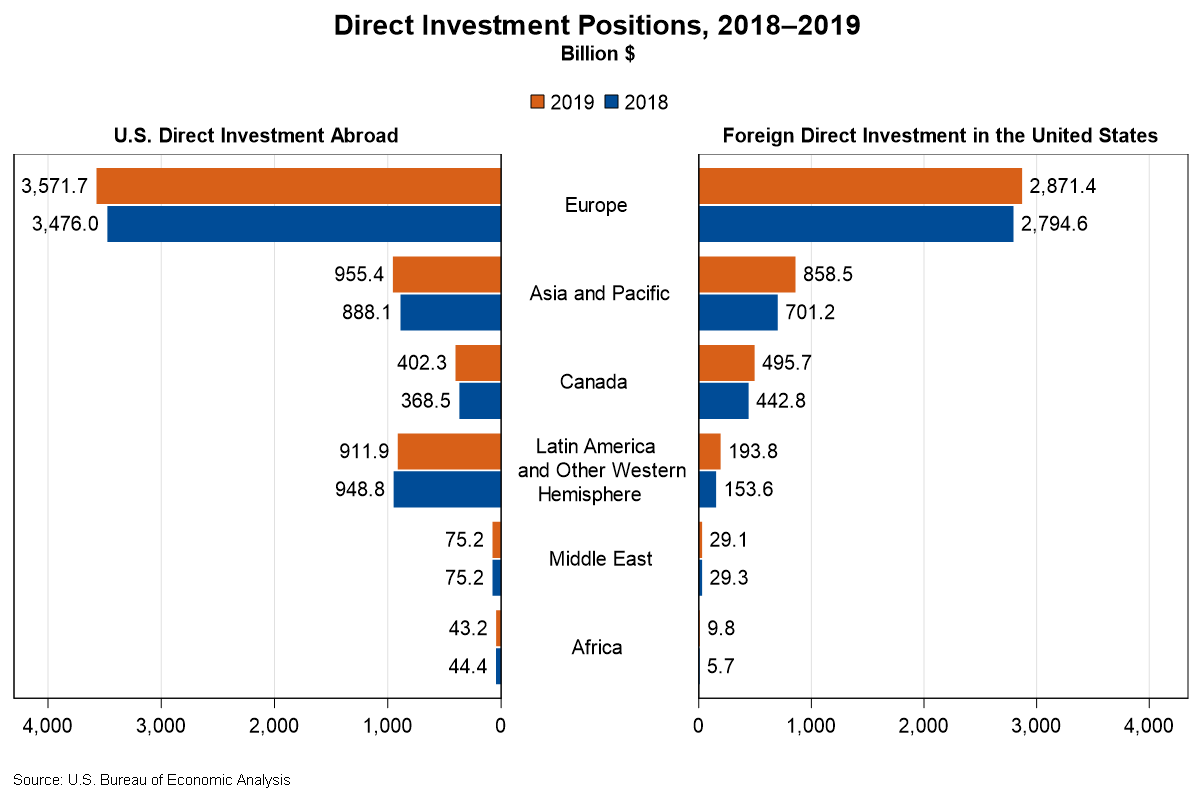
The U.S. direct investment abroad position, or cumulative level of investment, increased $158.6 billion to $5.96 trillion at the end of 2019 from $5.80 trillion at the end of 2018, according to statistics released by the Bureau of Economic Analysis (BEA). The increase reflected a $95.7 billion increase in the position in Europe, primarily in the United Kingdom and the Netherlands. By industry, manufacturing affiliates accounted for most of the increase.
The foreign direct investment in the United States position increased $331.2 billion to $4.46 trillion at the end of 2019 from $4.13 trillion at the end of 2018. The increase mainly reflected a $157.3 billion increase in the position from Asia and Pacific, primarily Japan. By industry, affiliates in manufacturing, finance and insurance, and wholesale trade accounted for the largest increases.
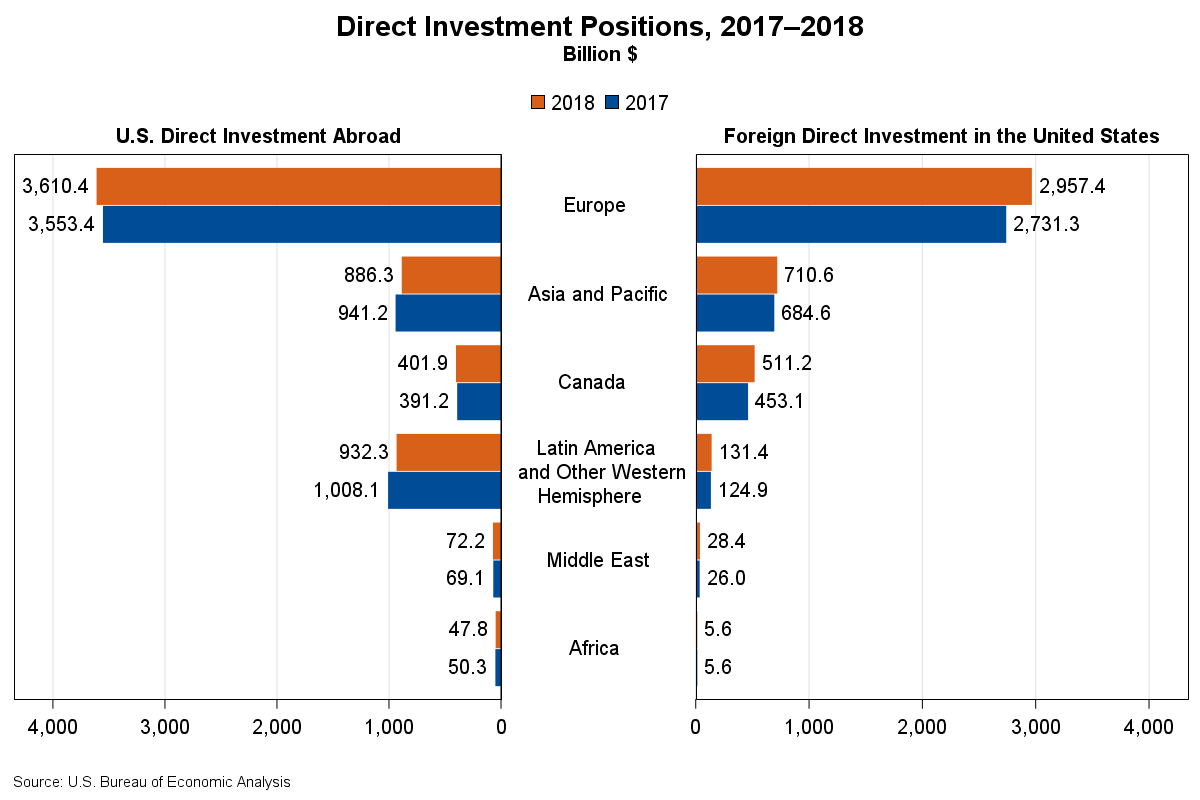
The U.S. direct investment abroad position, or cumulative level of investment, decreased $62.3 billion to $5.95 trillion at the end of 2018 from $6.01 trillion at the end of 2017. The decrease was due to the repatriation of accumulated prior earnings by U.S. multinationals from their foreign affiliates, largely in response to the 2017 Tax Cuts and Jobs Act. The decrease reflected a $75.8 billion decrease in the position in Latin America and Other Western Hemisphere, primarily in Bermuda. By industry, holding company affiliates owned by U.S. manufacturers accounted for most of the decrease.
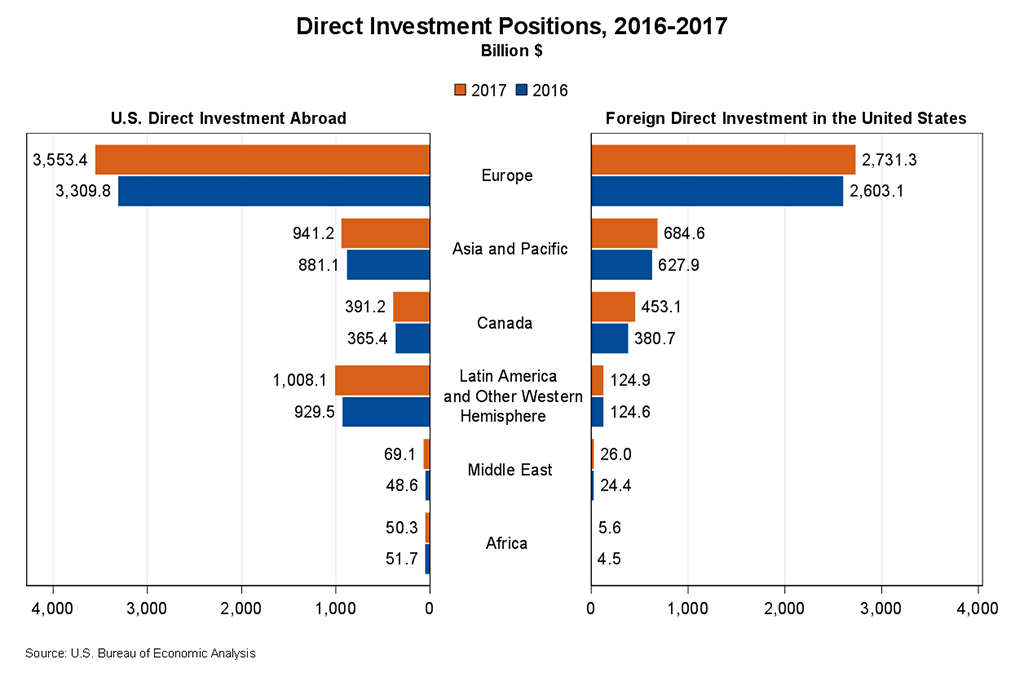
In 2017, the U.S. direct investment abroad position increased to $6,013.3 billion and the foreign direct investment in the United States position increased to $4,025.5 billion, according to statistics released by the Bureau of Economic Analysis (BEA). The increases were mainly due to increased investment with countries in Europe.
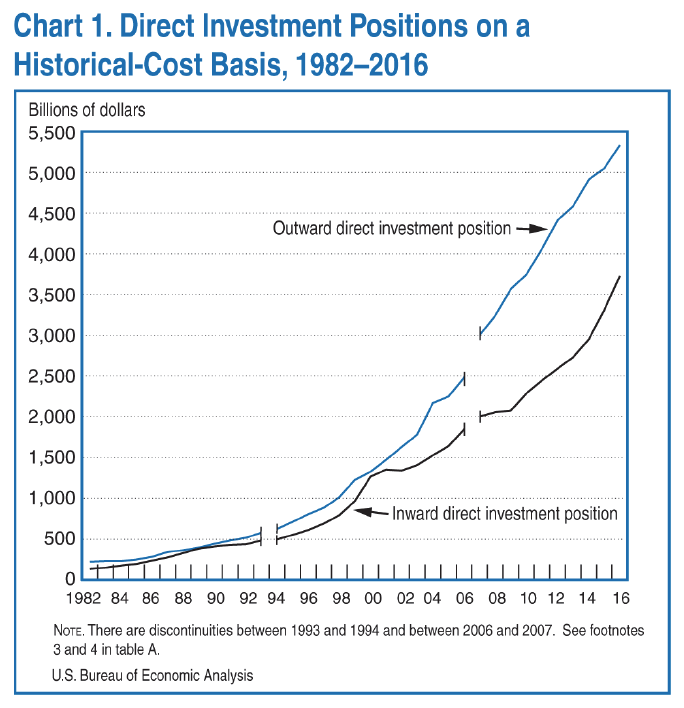
Outward and Inward U.S. foreign direct investment continued to grow in 2016. The U.S. direct investment position abroad valued at historical cost grew 5.6 percent to $5,332.2 billion, compared with an average annual growth rate of 8.2 percent in 2006–2015. The foreign direct investment position in the United States valued at historical cost grew 12.8 percent to $3,725.4 billion, compared with an average annual growth rate of 6.7 percent in 2006–2015.