BEA 25-14
Scheduled Date
April 2 10:00:am
Release Title
Arts and Cultural Production Satellite Account, U.S. and States, 2023

An official website of the United States government
|
Arts and culture economic activity, 2023
|
$1.17 T
|
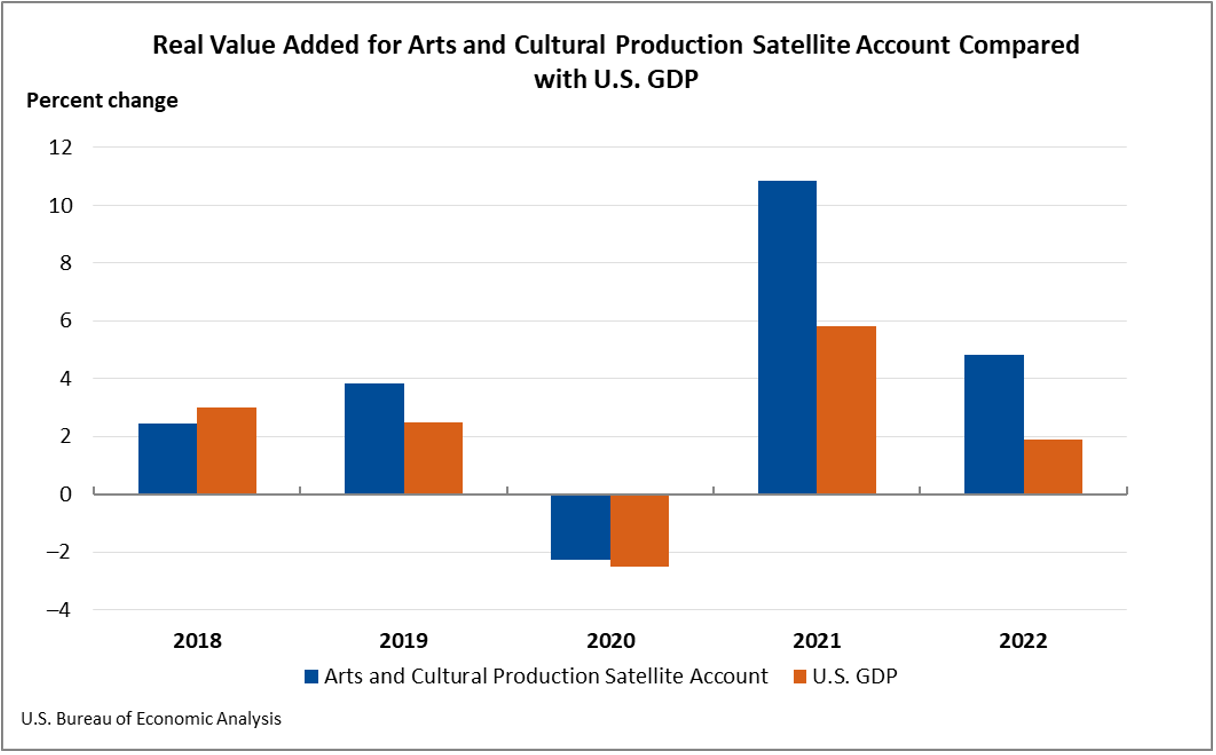
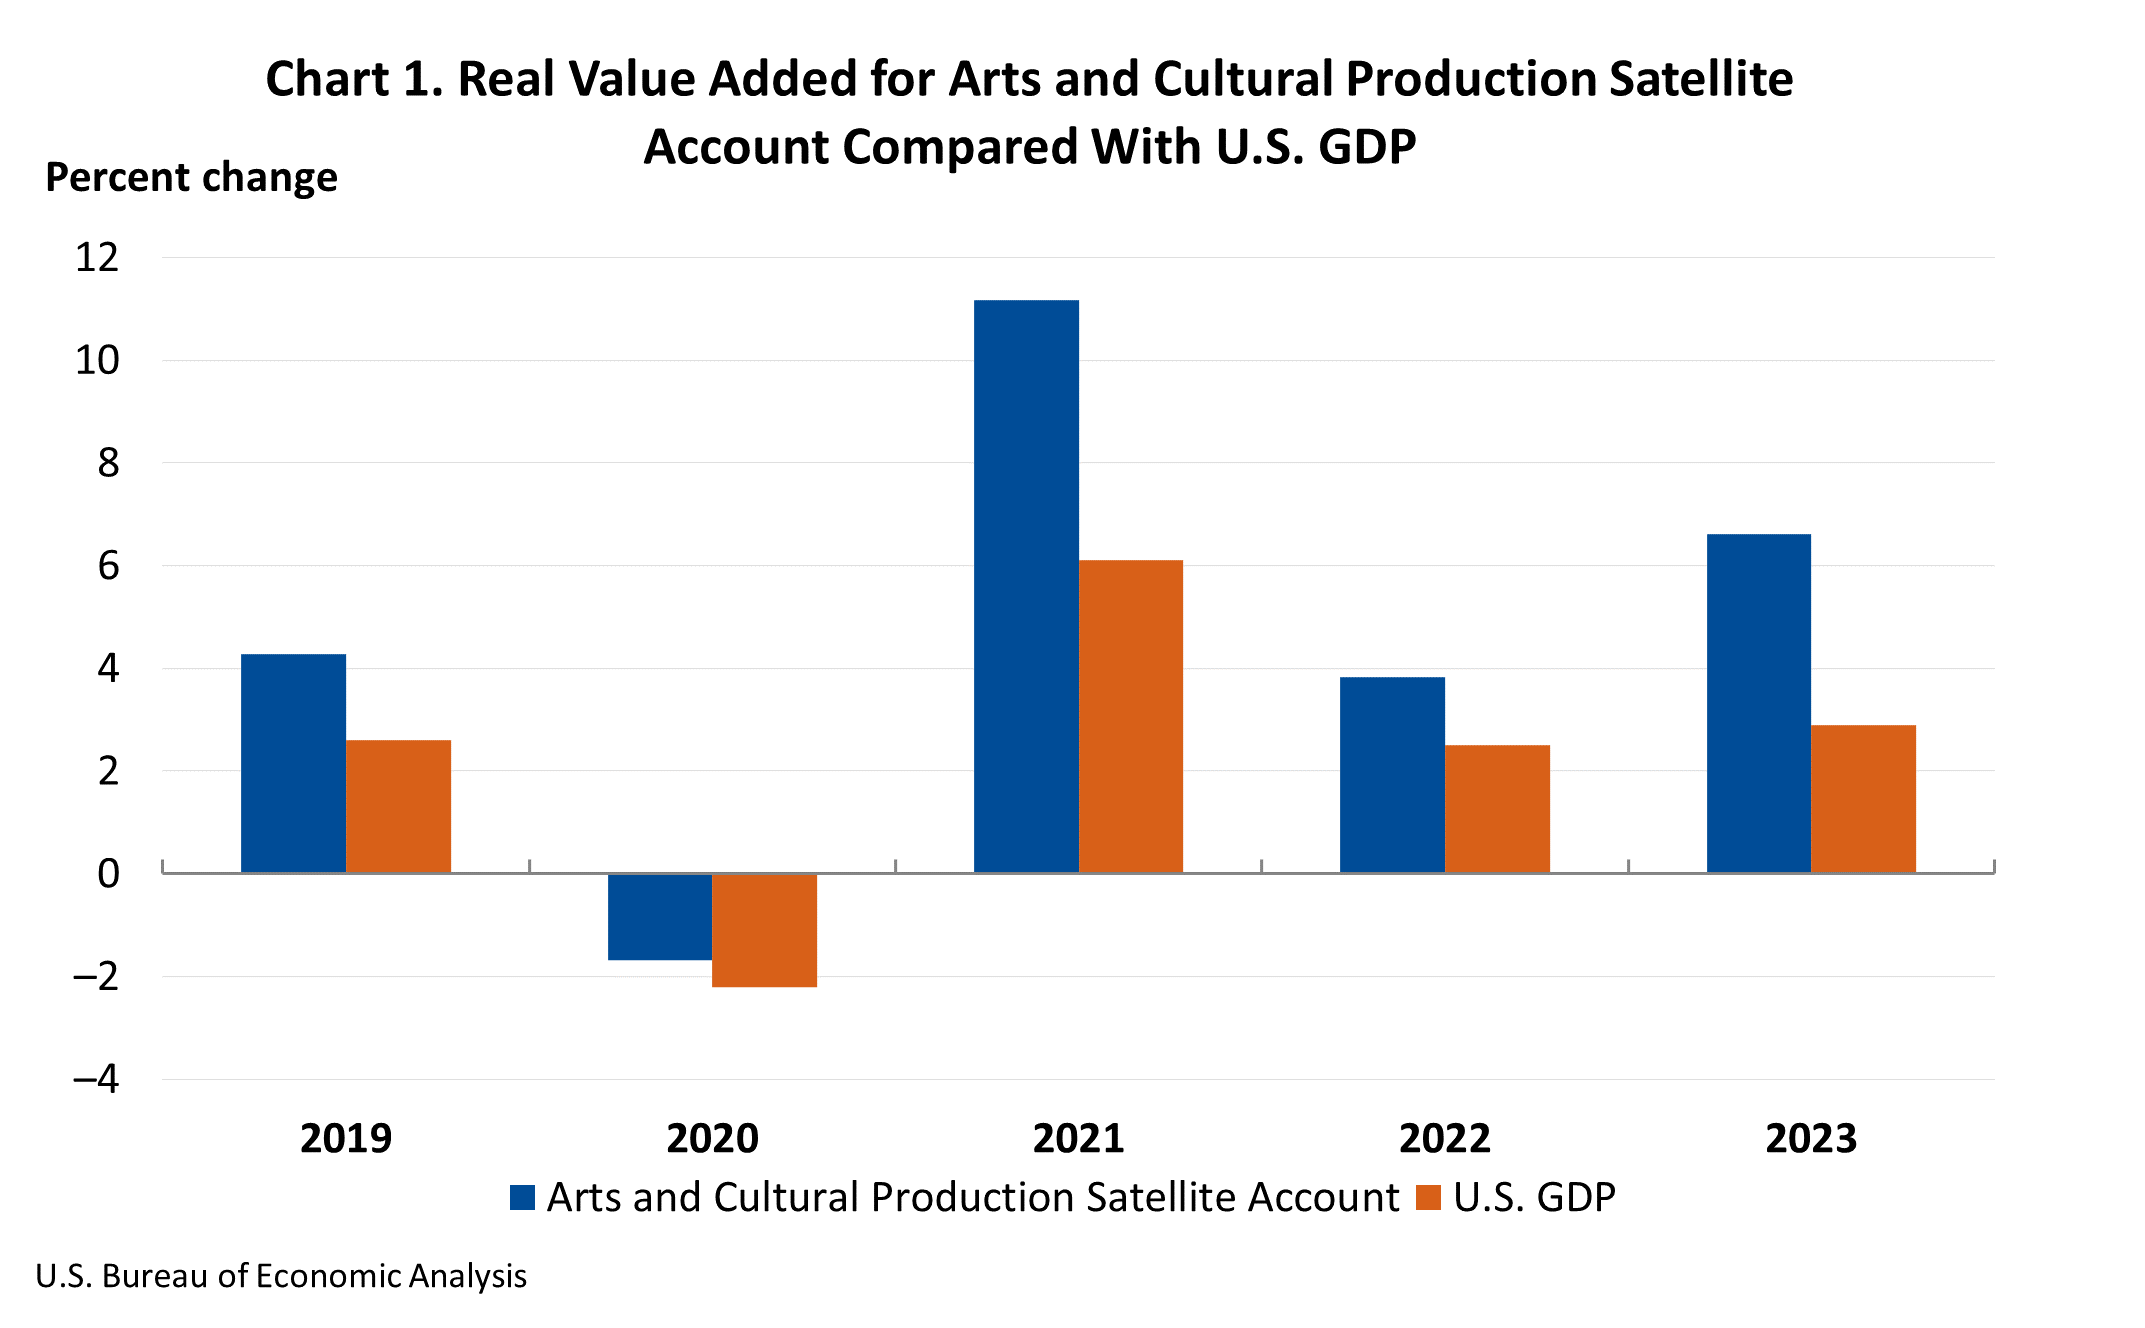
The Arts and Cultural Production Satellite Account released by the U.S. Bureau of Economic Analysis shows that arts and cultural economic activity, adjusted for inflation, increased 6.6 percent in 2023 after increasing 3.8 percent in 2022. By comparison, the broader economy, as measured by real gross domestic product (GDP), increased 2.9 percent in 2023 after increasing 2.5 percent in 2022. Arts and cultural economic activity accounted for 4.2 percent of GDP, or $1.17 trillion, in 2023.
|
Arts and culture economic activity, 2022
|
$1.10 trillion
|
The Arts and Cultural Production Satellite Account released today by the U.S. Bureau of Economic Analysis (BEA) shows that arts and cultural economic activity, adjusted for inflation, increased 4.8 percent in 2022 after increasing 10.8 percent in 2021. By comparison, the broader economy, as measured by real gross domestic product (GDP), increased 1.9 percent in 2022 after increasing 5.8 percent in 2021. Arts and cultural economic activity accounted for 4.3 percent of GDP, or $1.10 trillion, in 2022.
|
Arts and culture economic activity (2021)
|
$1.02 trillion
|
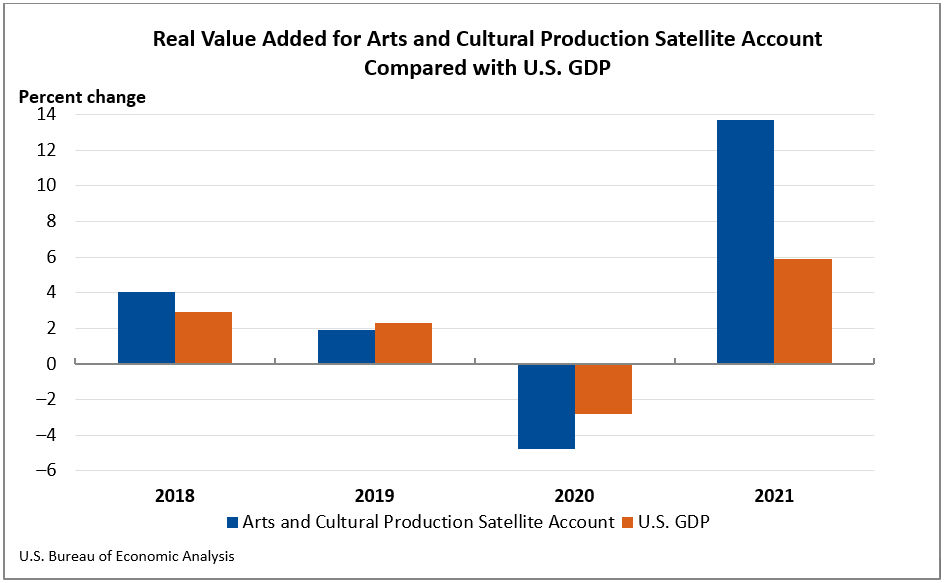
The Arts and Cultural Production Satellite Account released today by the Bureau of Economic Analysis (BEA) shows that arts and cultural economic activity, adjusted for inflation, increased 13.7 percent in 2021 after decreasing 4.8 percent in 2020. By comparison, the broader economy, as measured by real gross domestic product (GDP), increased 5.9 percent in 2021 after decreasing 2.8 percent in 2020. Arts and cultural economic activity accounted for 4.4 percent of gross domestic product (GDP), or $1.02 trillion, in 2021.
|
Arts and culture economic activity (2020)
|
$876.7 billion
|
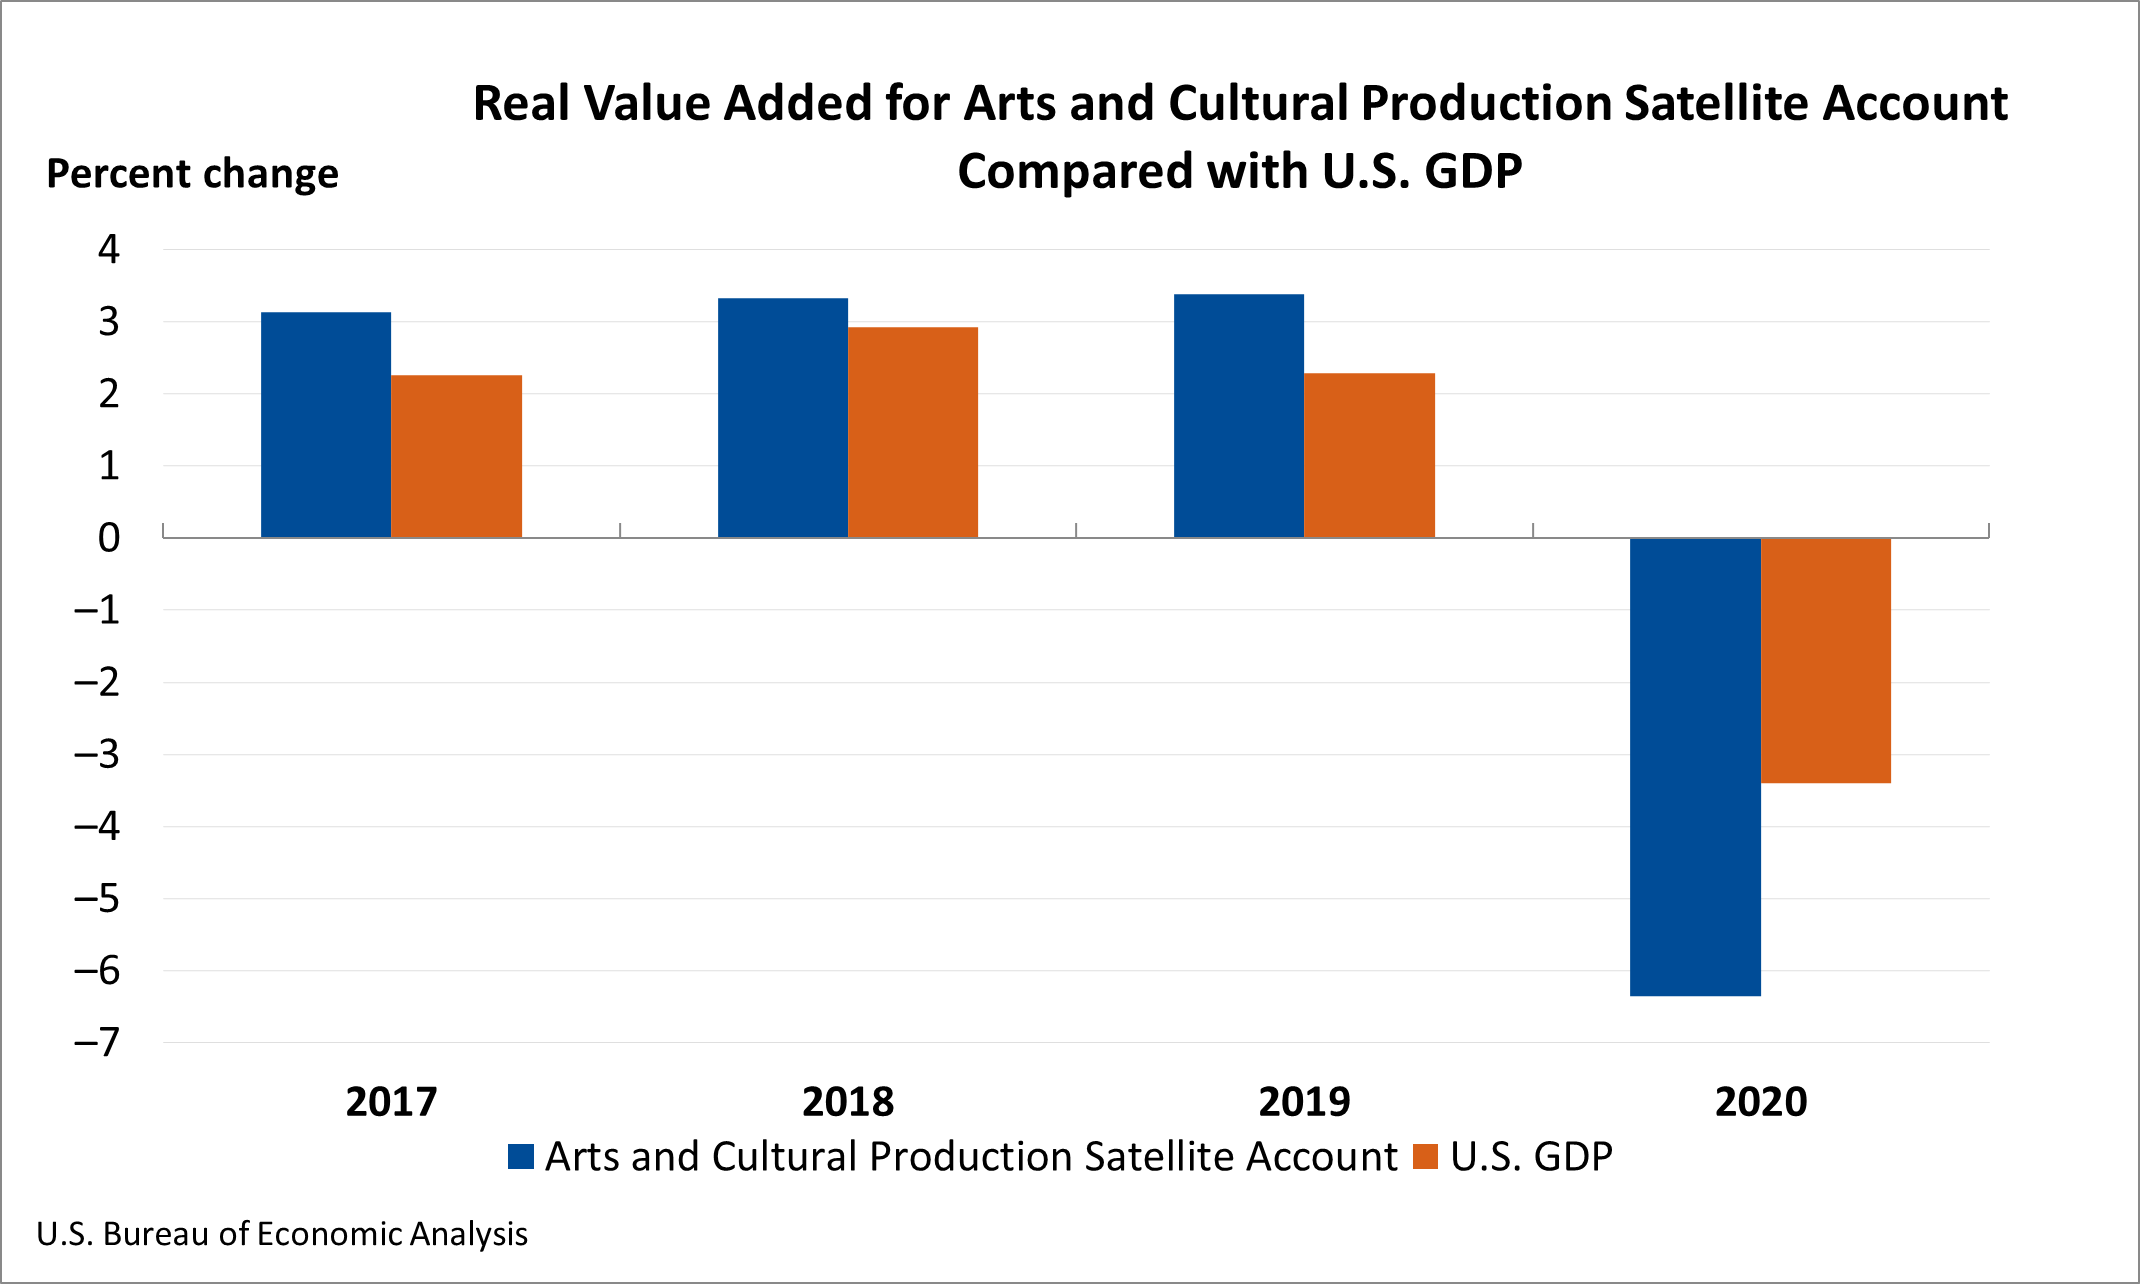
The Arts and Cultural Production Satellite Account released today by the U.S. Bureau of Economic Analysis (BEA) shows that arts and cultural economic activity, adjusted for inflation, decreased 6.4 percent in 2020 after increasing 3.4 percent in 2019. Arts and cultural economic activity accounted for 4.2 percent of gross domestic product (GDP), or $876.7 billion, in 2020.
|
Arts and culture economic activity (2019)
|
$919.7 billion
|
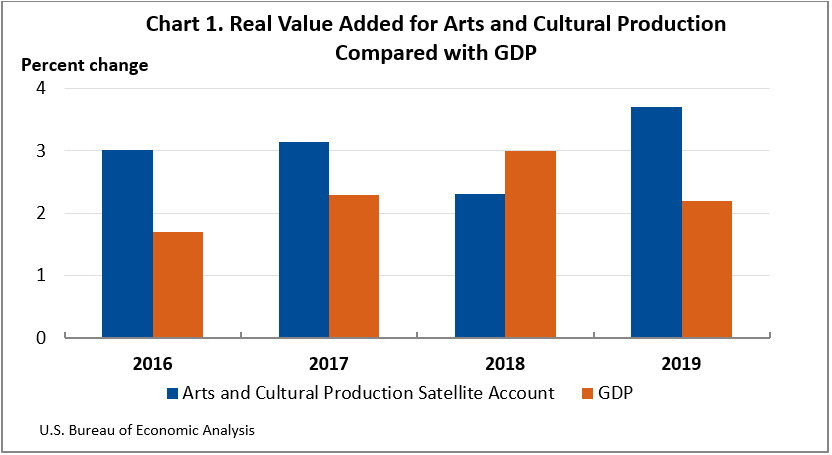
The Arts and Cultural Production Satellite Account released today by the U.S. Bureau of Economic Analysis (BEA) shows that arts and cultural economic activity, adjusted for inflation, increased 3.7 percent in 2019 after increasing 2.3 percent in 2018. Arts and cultural economic activity accounted for 4.3 percent, or $919.7 billion, of current-dollar gross domestic product (GDP), in 2019.
|
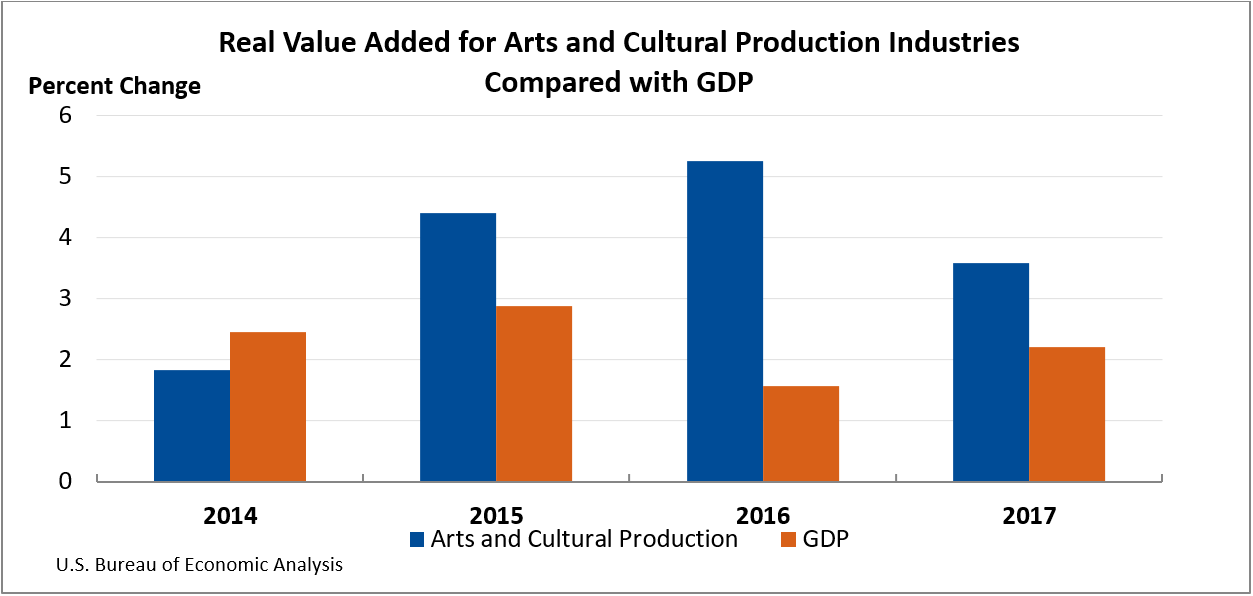
Arts and cultural economic activity (2017)
|
$877.8 billion
|
The Arts and Cultural Production Satellite Account released today by the U.S. Department of Commerce's Bureau of Economic Analysis (BEA) shows that arts and cultural economic activity, adjusted for inflation, increased 3.6 percent in 2017. That compares with a 5.3 percent increase in 2016. Arts and cultural economic activity accounted for 4.5 percent of gross domestic product (GDP), or $877.8 billion, in 2017.