
News Release
Arts and Cultural Production Satellite Account, U.S. and States, 2020
New statistics for 2020; prior years updated
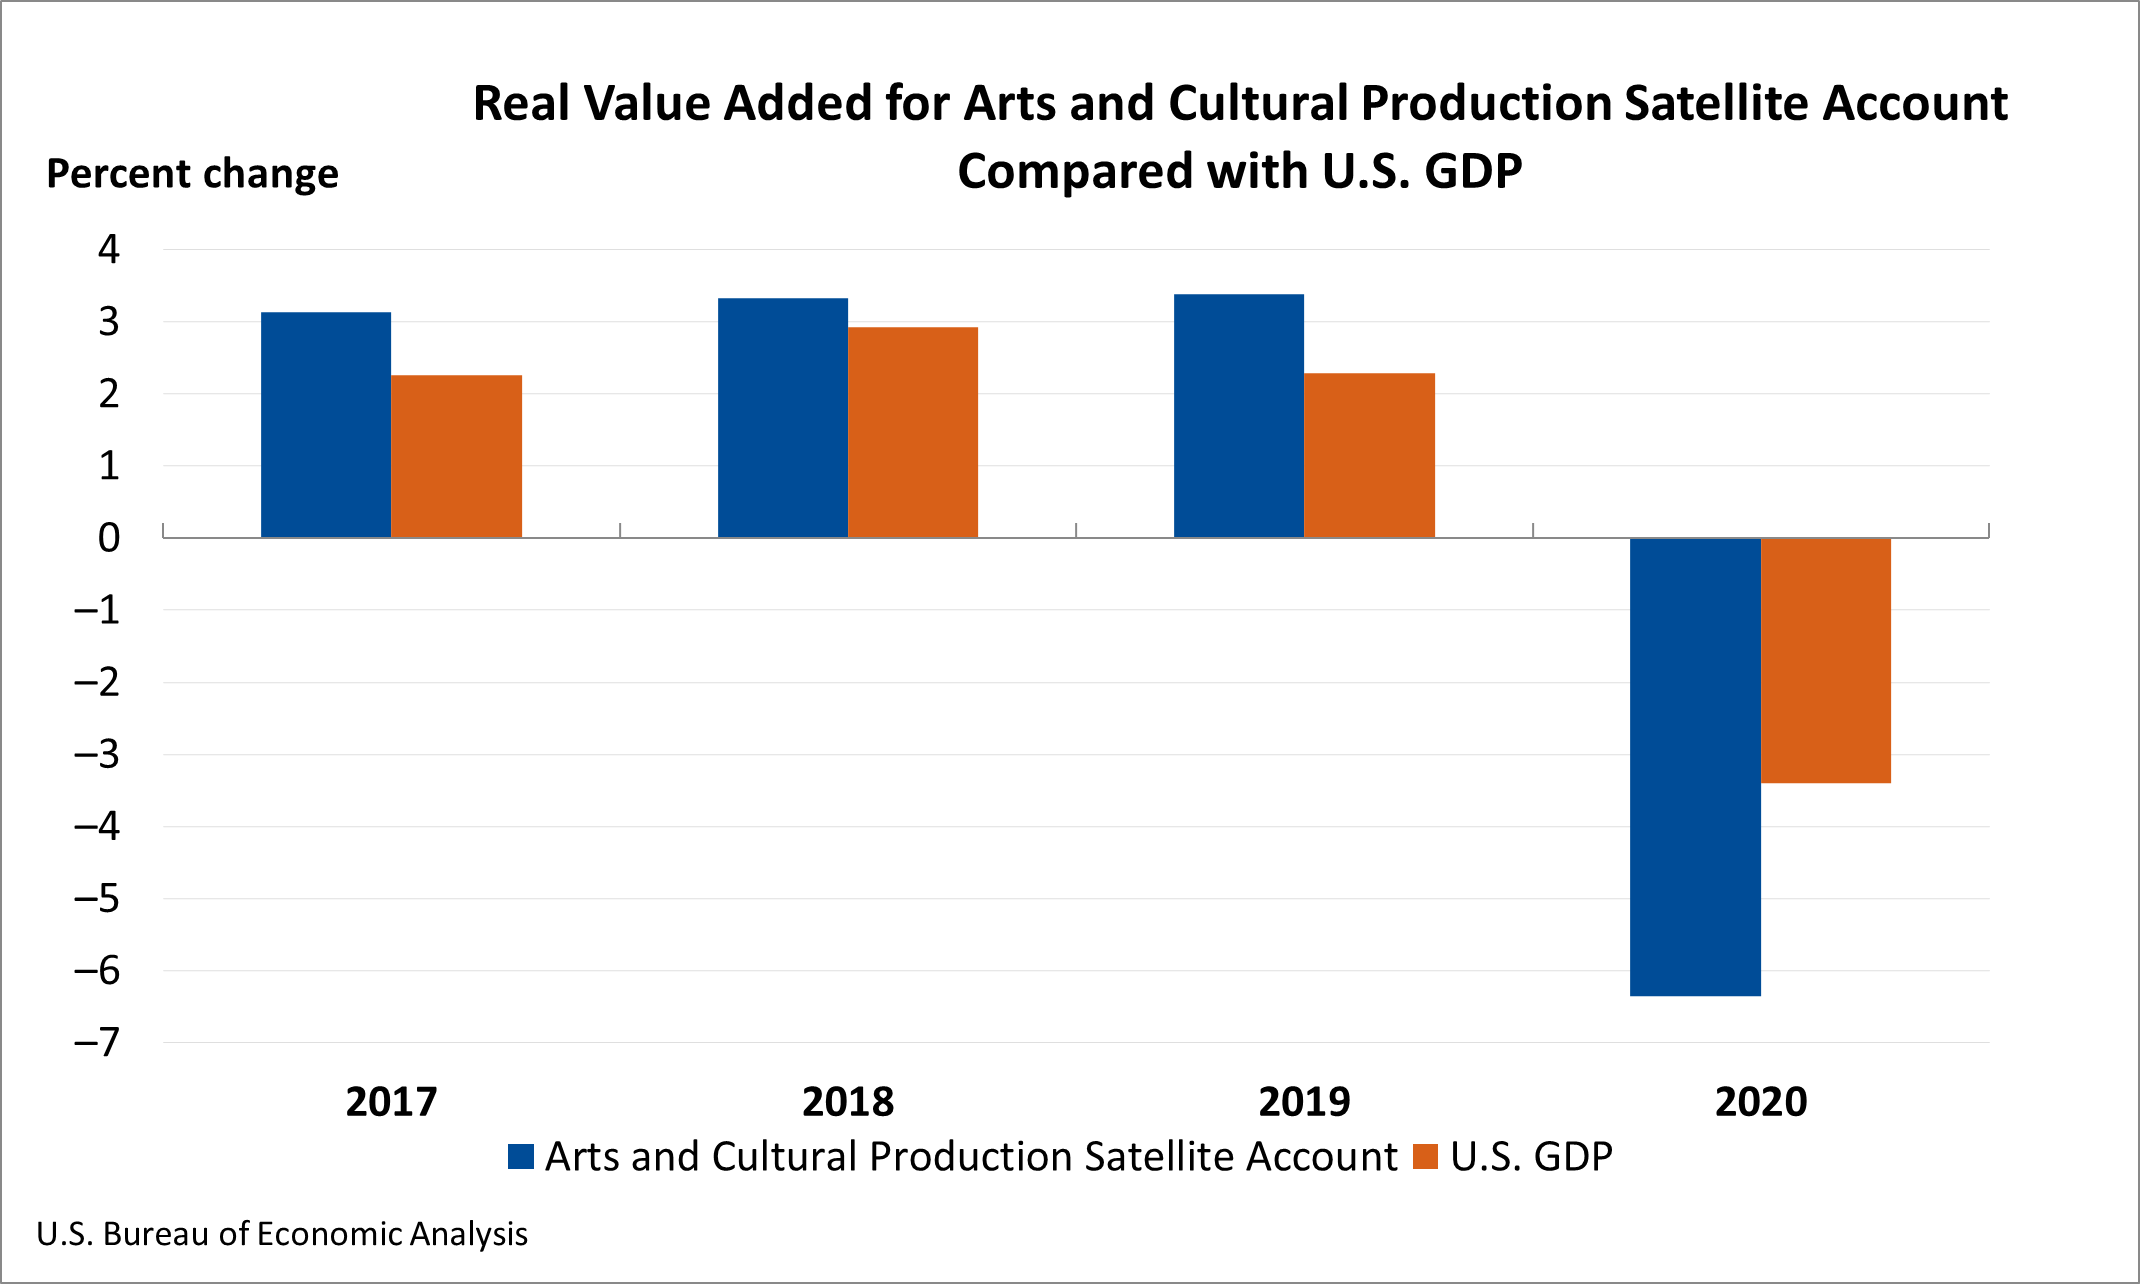
The Arts and Cultural Production Satellite Account released today by the U.S. Bureau of Economic Analysis (BEA) shows that arts and cultural economic activity, adjusted for inflation, decreased 6.4 percent in 2020 after increasing 3.4 percent in 2019 (table 1). Arts and cultural economic activity accounted for 4.2 percent of gross domestic product (GDP), or $876.7 billion, in 2020 (tables 2 and 3).
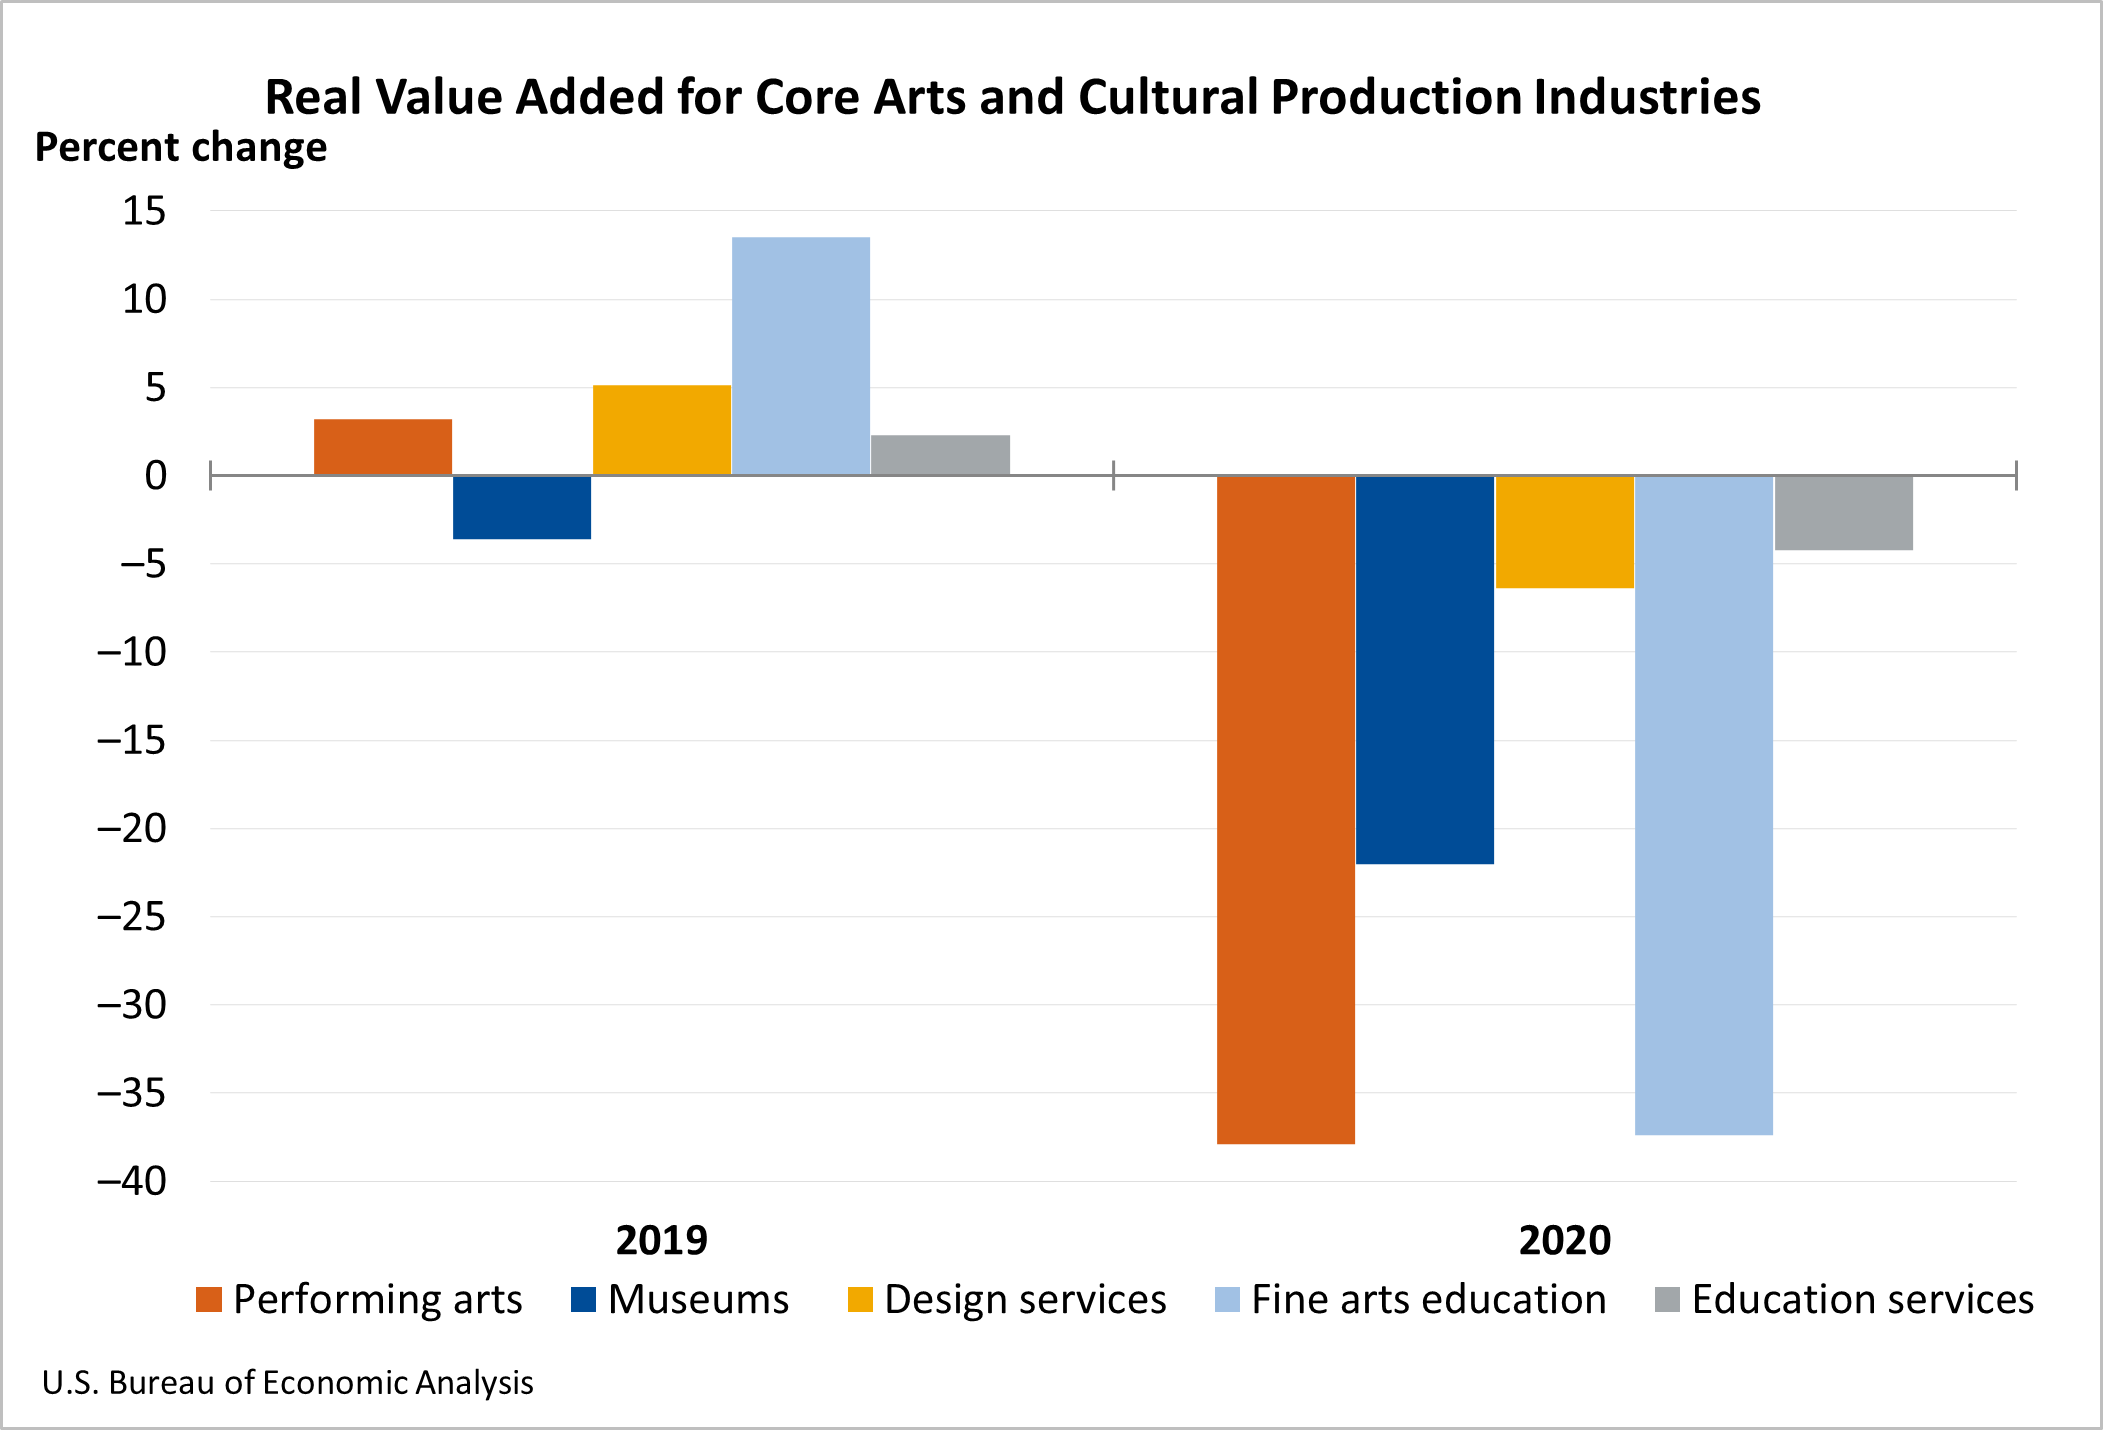
Core arts and cultural production industries, which includes performing arts, museums, design services, fine arts education, and education services, decreased 20.6 percent, adjusted for inflation, in 2020. Supporting arts and cultural production industries, which includes art support services and information services, decreased 1.9 percent in 2020 (table 1).
Arts and cultural production estimates were impacted by the response to the spread of COVID-19, as governments issued and lifted "stay-at-home" orders. This led to rapid changes in demand as consumers canceled, restricted, or redirected their spending. The U.S. government passed several laws to support and sustain businesses and individuals through the pandemic. The full economic effects of the COVID-19 pandemic cannot be quantified in the arts and cultural production estimates for 2020, because the impacts are generally embedded in source data and cannot be separately identified. For more information, see Federal Recovery Programs and BEA Statistics.
- For performing arts, real value added decreased 37.9 percent in 2020 after increasing 3.2 percent in 2019. The leading contributor to the decrease was promoters of performing arts and similar events, which decreased 72.8 percent in 2020 after increasing 2.1 percent in 2019.
- Museums decreased 22.0 percent in 2020 after decreasing 3.6 percent in 2019.
- Design services decreased 6.4 percent in 2020 after increasing 5.1 percent in 2019.
- Fine arts education decreased 37.4 percent in 2020 after increasing 13.5 percent in 2019.
- Education services decreased 4.2 percent in 2020 after increasing 2.3 percent in 2019.
Nominal value added
Nominal value added (not adjusted for inflation) decreased 5.8 percent nationally in 2020 (table 2). The leading contributor to the decrease was core arts and cultural production industries (table 4). Core arts and cultural production industries decreased 19.6 percent, to a level of $167.8 billion; the leading contributor to the decrease was performing arts, which includes independent artists, writers, and performers. Supporting arts and cultural industries decreased 1.5 percent in 2020, to a level of $689.0 billion; the leading contributors to the decrease were wholesale and transportation industries as well as information services.
In 2020, nominal value added in arts and cultural industries decreased in every state and the District of Columbia except Washington. The percent change in value added in arts and cultural industries across all states ranged from 9.4 percent in Washington to –22.1 percent in Nevada (table 2).
In Washington, the only state with an increase in value added, other information services and retail industries were the leading contributors to the increase in value added (table 4). Construction was the leading contributor to the decrease in value added in Nevada.
For states and the District of Columbia, the arts and cultural share of their total GDP ranged from 10.3 percent in Washington to 1.1 percent in Delaware (table 3). The share for most states ranged between 2 and 5 percent. Washington, the District of Columbia, California, and New York were the only areas where the arts and culture share of total GDP exceeded 5 percent.
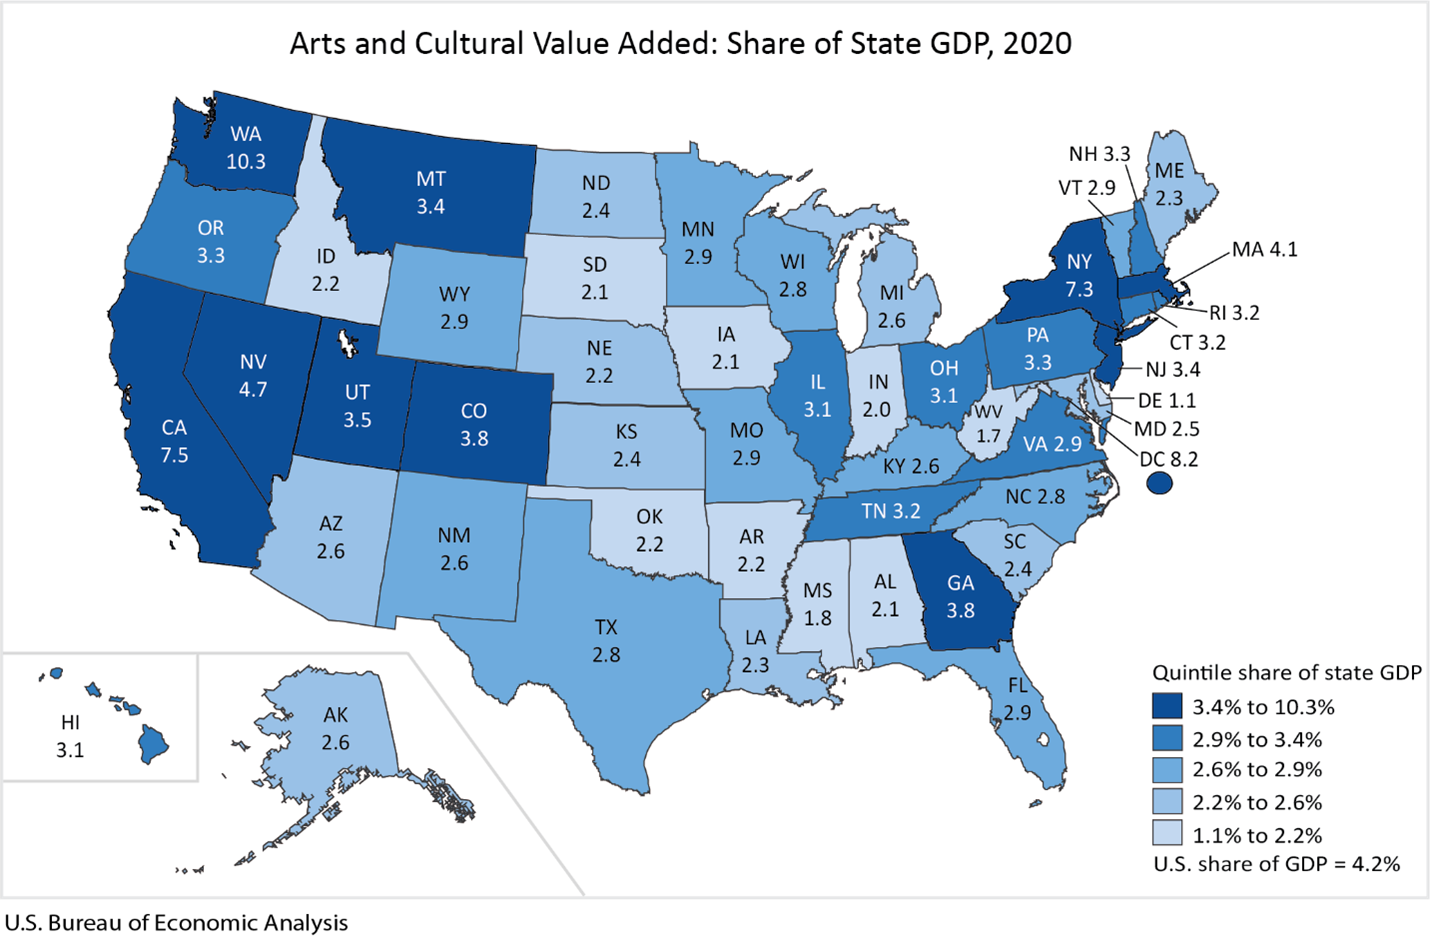
The top arts and cultural industries varied among the states. In Washington, publishing and other information services were the leading contributors to the share of total state GDP (table 3). Government and broadcasting were the leading contributors to the share of GDP in the District of Columbia, while other information services and motion pictures were the leading contributors to the share of GDP in California.
Employment
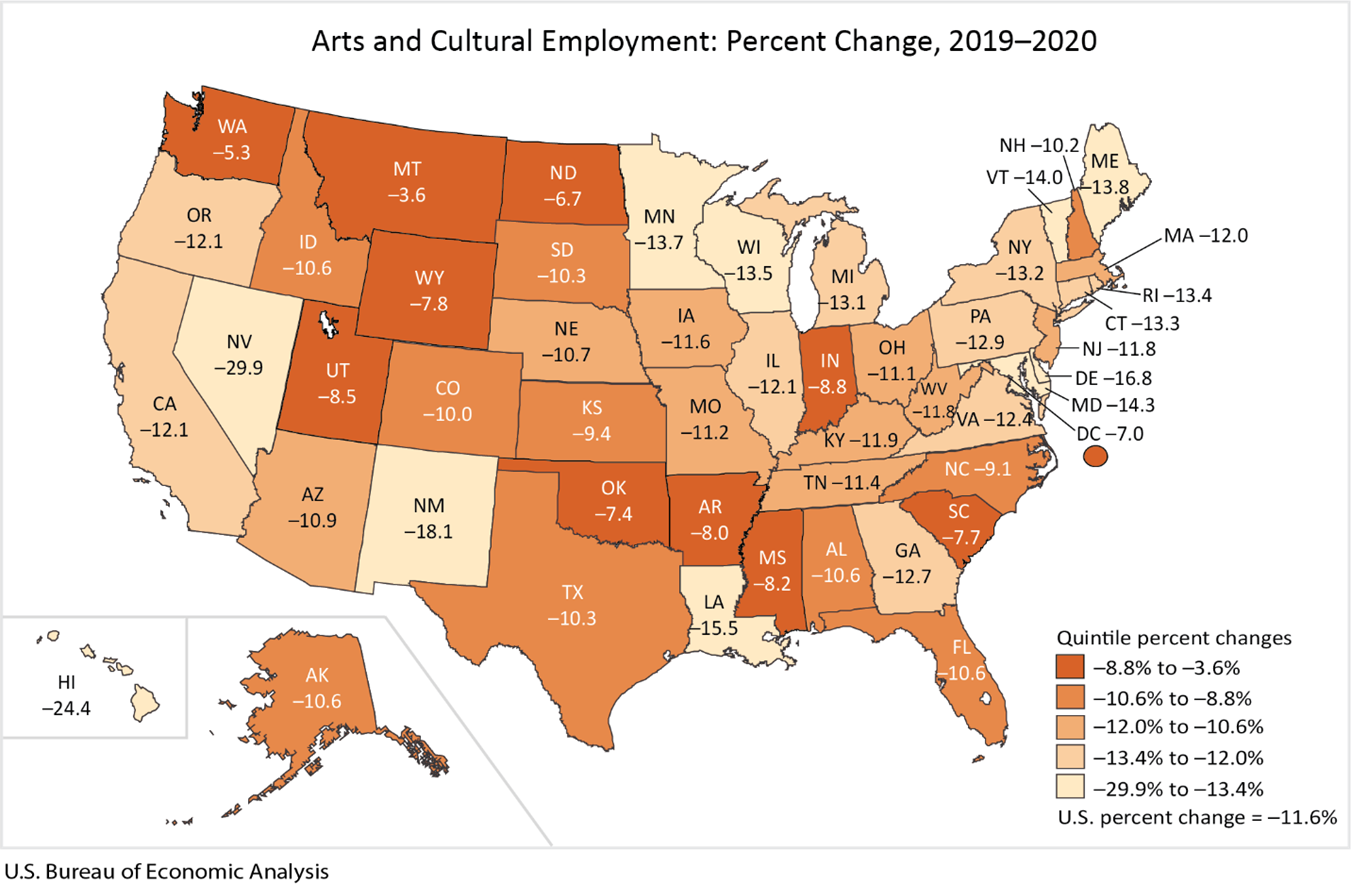
Arts and cultural employment nationwide decreased 11.6 percent in 2020 (table 8). The total number of arts and cultural jobs for the nation was 4.6 million. Arts and cultural employment decreased in all 50 states and the District of Columbia. The percent change in arts and cultural employment across all states ranged from –3.6 percent in Montana to –29.9 percent in Nevada.
Montana had 15,230 jobs related to arts and culture, representing 3.1 percent of all jobs in the state. Contributions from the construction industry mitigated the impact from declines in other arts and cultural industries in Montana (table 9). In Nevada, construction was the leading contributor to the decrease in arts and cultural employment.
Compensation
Arts and cultural compensation nationwide decreased 0.2 percent in 2020 (table 8). Arts and cultural compensation increased in 13 states and the District of Columbia and was unchanged in 2 states. The percent change in arts and cultural compensation across all states ranged from 9.7 percent in Washington to –26.1 percent in Nevada.
Today, BEA also released updated national-level arts and cultural production statistics on output, value added, intermediate inputs, employment, and compensation from 1999 to 2019, with new statistics for 2020, and updated state-level statistics on value added, employment, and compensation from 2001 to 2019, with new statistics for 2020. These revised and newly available statistics primarily reflect the incorporation of revised and newly available source data. Combined with new and revised arts and cultural production-specific source data, these improvements allow the arts and cultural production statistics to more accurately capture the dynamics of this sector. With this release, the arts and cultural production statistics reflect the incorporation of the 2021 annual updates of BEA's National and Regional Economic Accounts.
BEA's Arts and Cultural Production Satellite Account is supported by funding from the National Endowment for the Arts.