
Global Value Chains
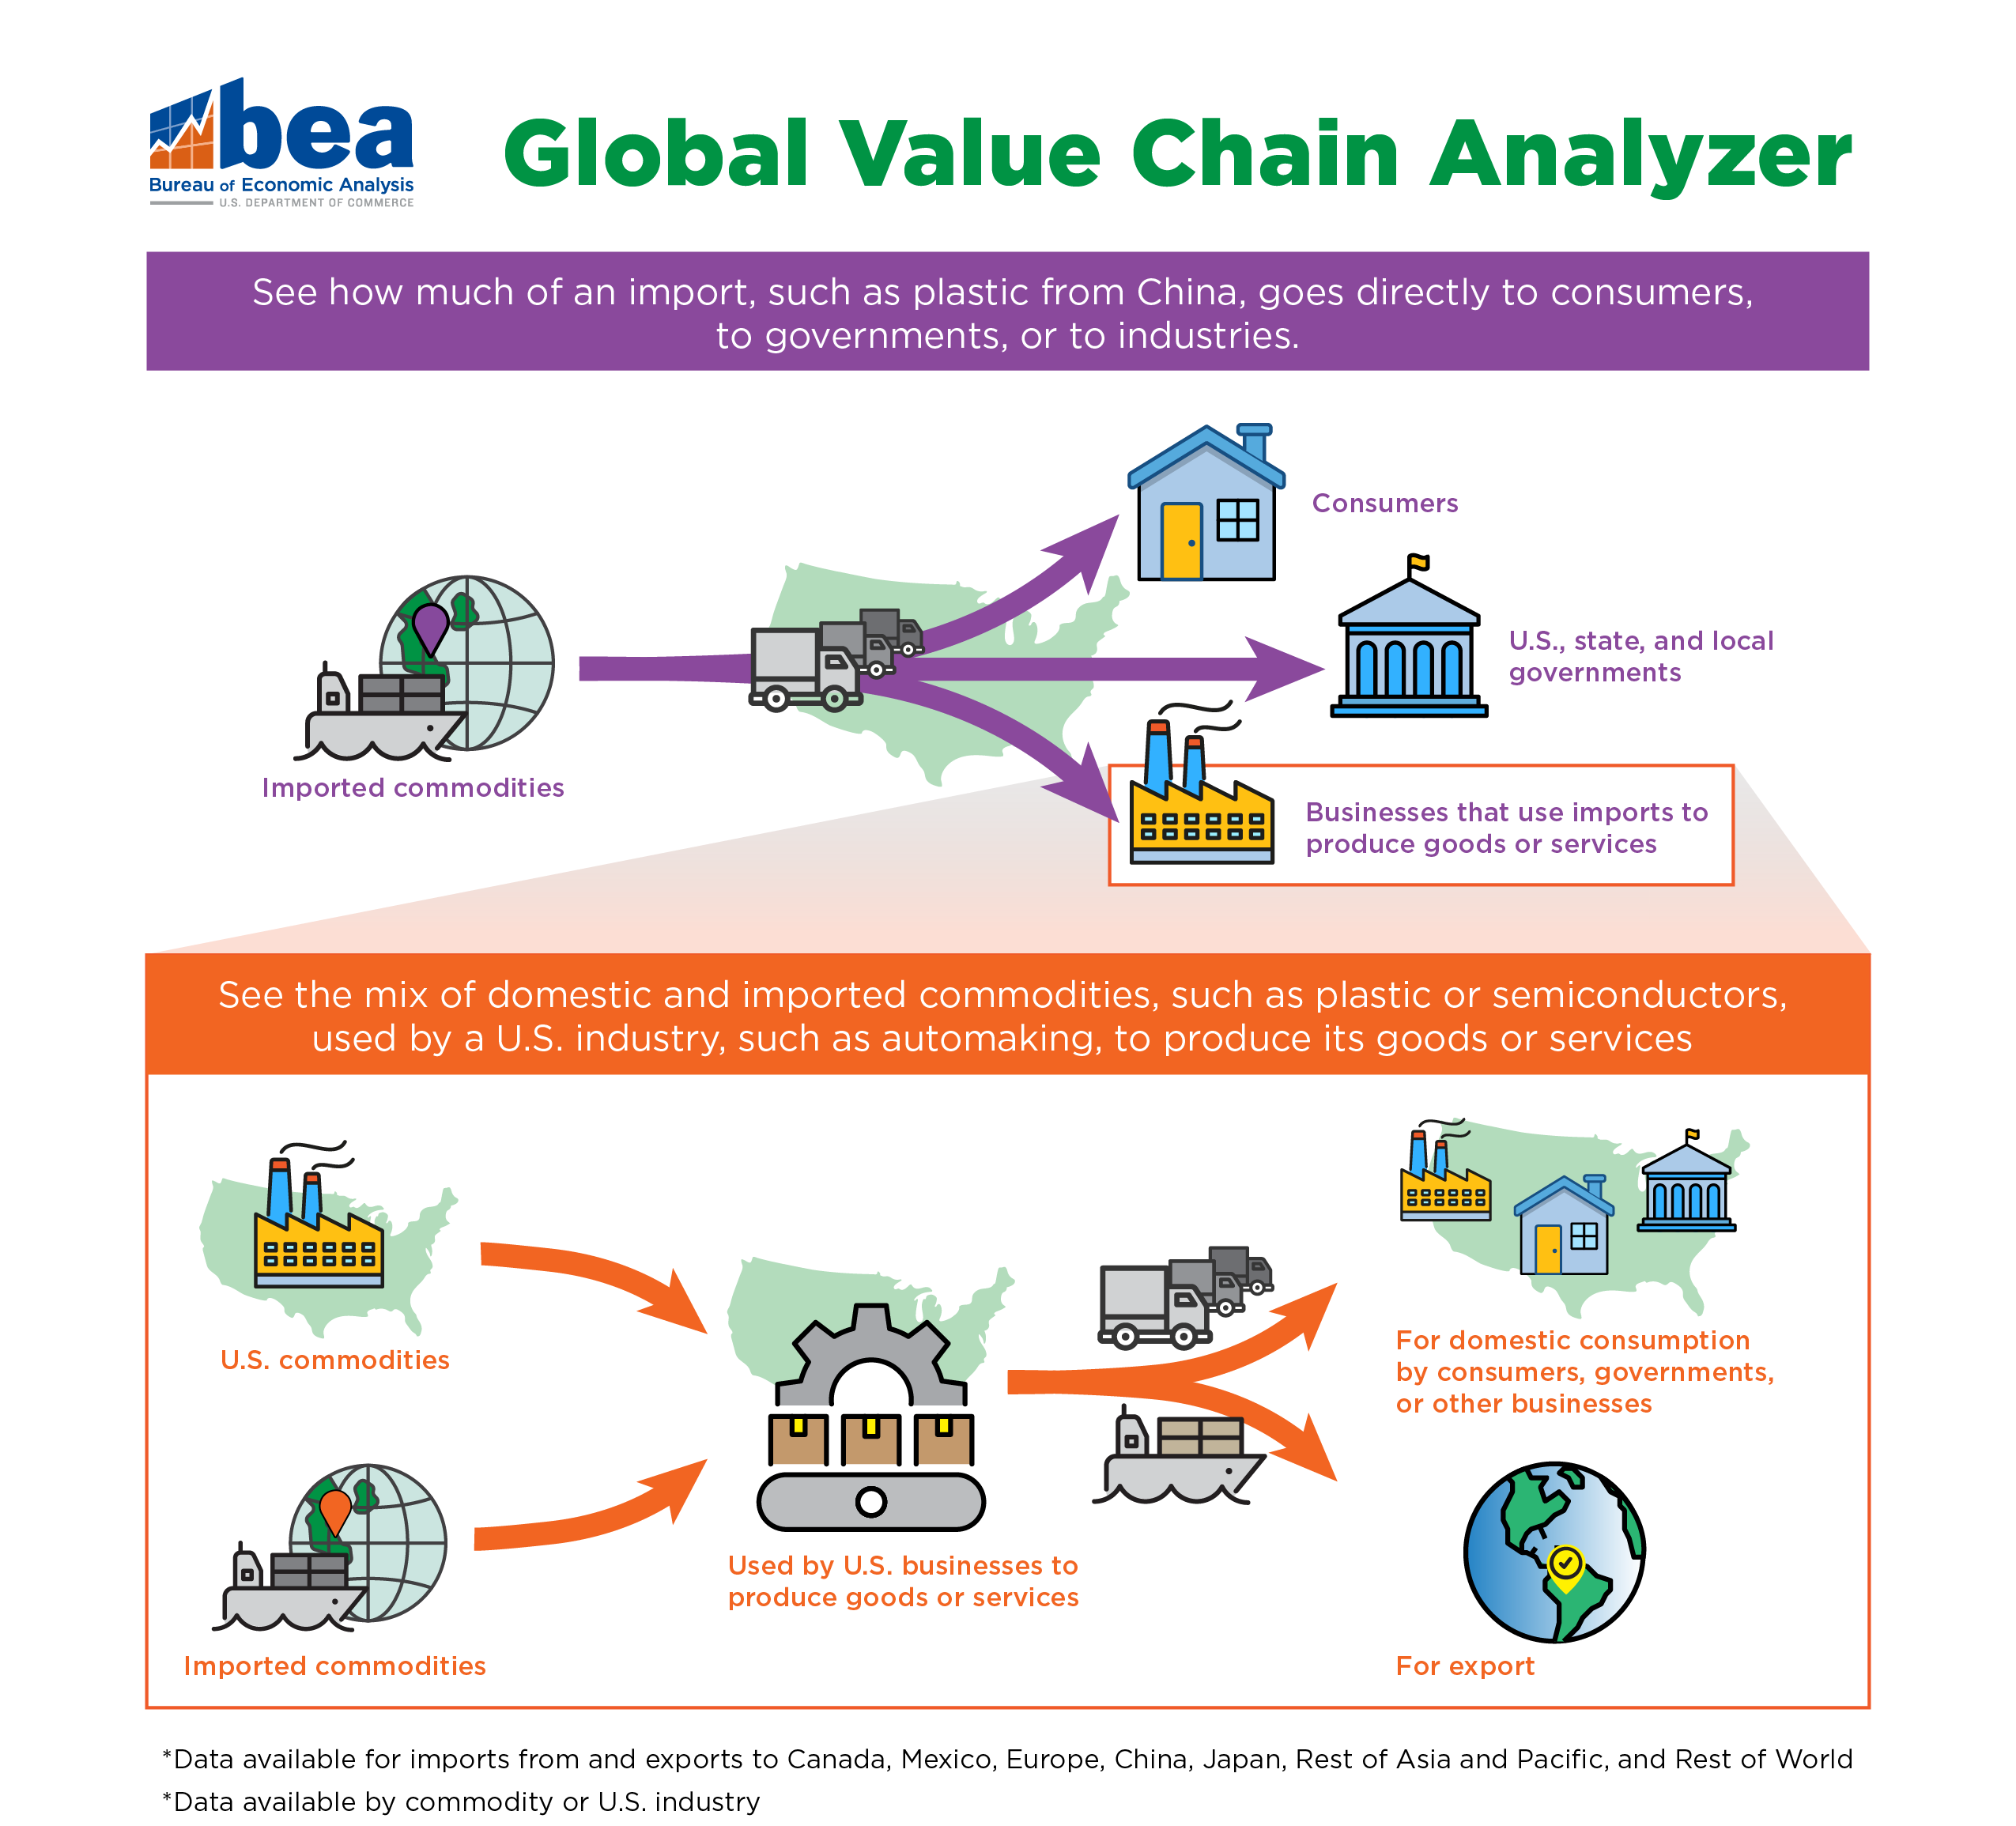
Global value chain statistics offer better understanding of supply chains that link other countries with the United States to produce goods or services. They show the mix of domestic and foreign value in production chains.
In May 2026, BEA significantly expanded its global value chain statistics—also called statistics on trade in value added, or TiVA—to cover goods and services sold to U.S. consumers, businesses, and governments, and those that become U.S. exports.
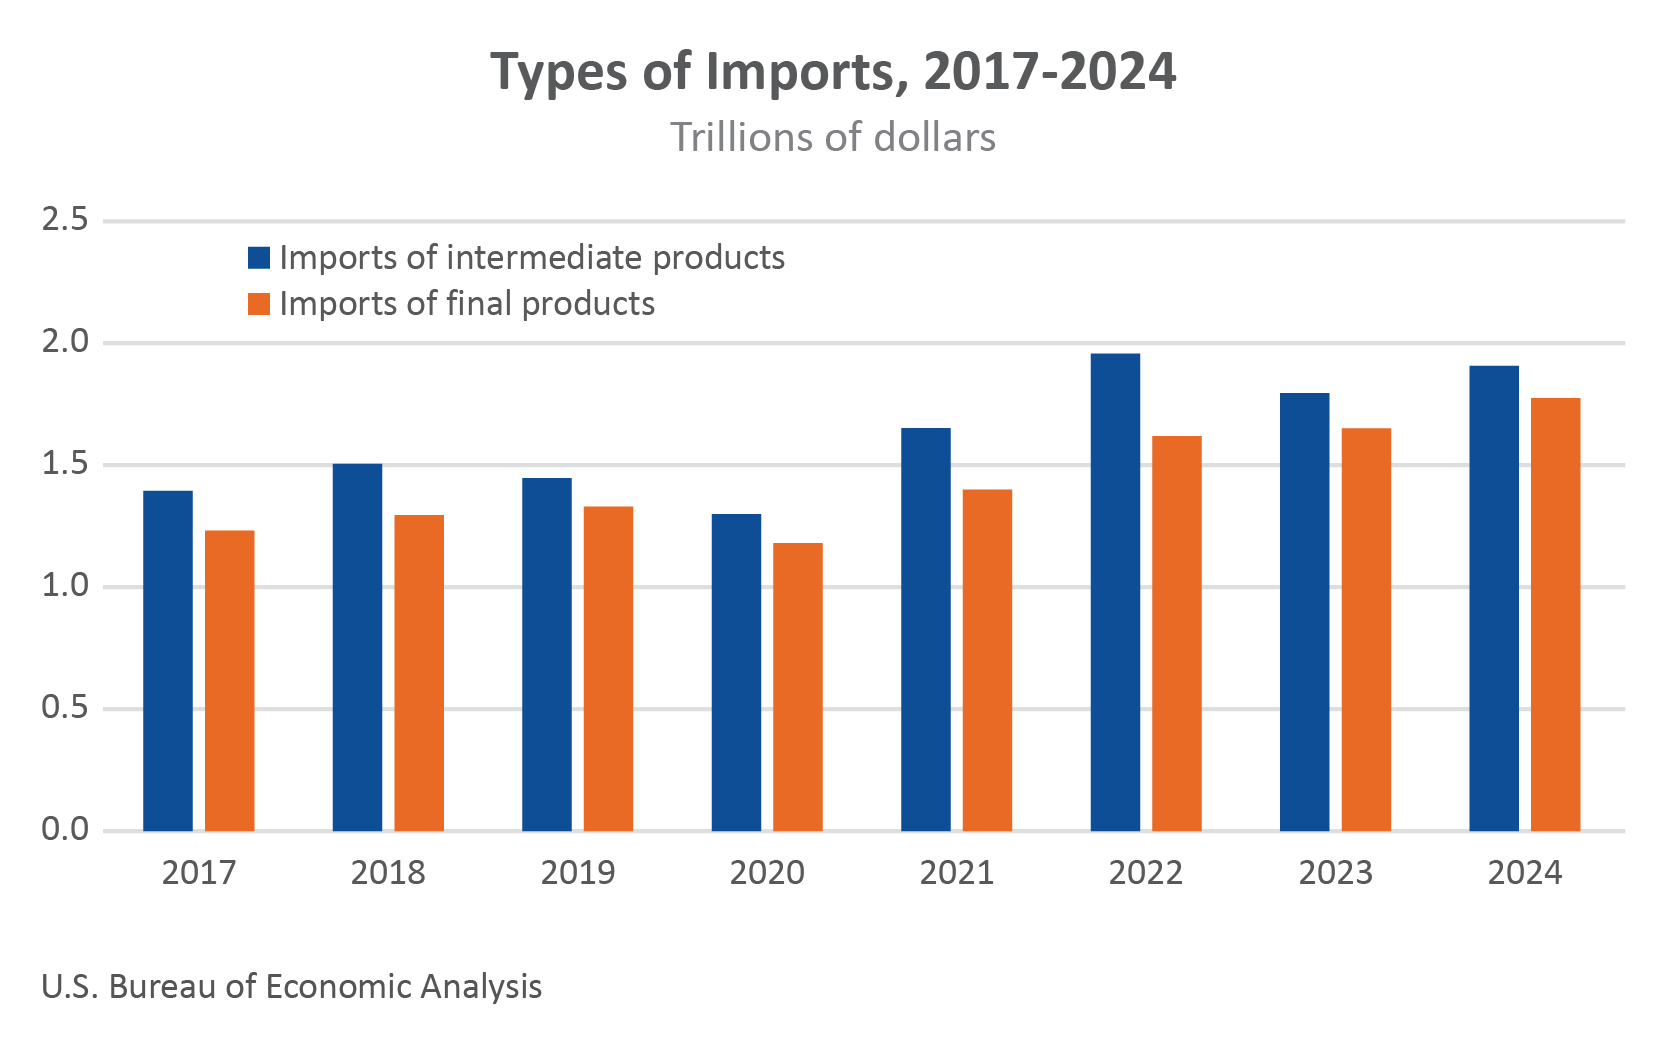
An accompanying data tool, the Global Value Chain Analyzer, lets users create custom tables to dig into the data. The data can be filtered by the value of domestic production; imported intermediate products used in domestic production; or imported final products.
Global value chain statistics help answer questions such as:
• What are the domestic and imported inputs used in a U.S. industry’s production?
• How does a U.S. industry contribute to global value chains?
• How much of an imported commodity is used in U.S. production versus sold as final products in the United States?
Current release: May 21, 2026
Note: To use the Global Value Chain Analyzer, select Interactive Data: Global Value Chain Analyzer in the Data & Documentation section.
- Interactive Data: Global Value Chain Analyzer
- User Guide: BEA’s National Trade in Value Added Dataset and the GVC Analyzer PDF
- Selected and Supporting Detail Tables
- Technical Document: Methodology for Preparing National Trade in Value Added (TiVA) Statistics for BEA’s Global Value Chain Analyzer Tool PDF
- Archive
- Sector to Industry Concordance XLSX
- Article: National Trade in Value Added Statistics: Uses and Applications HTM Survey of Current Business | February 2023
- A Primer on BEA's Industry Accounts
- Concepts and Methods of the U.S. Input-Output Accounts
- Slide Presentation: Single Country Trade in Value Added PDF
- BEA’s statistics on trade in value added are being developed in collaboration with the National Center for Science and Engineering Statistics of the National Science Foundation. GOV
What is Trade in Value Added?
Data showing the domestic and imported sources of value used in U.S. production of goods and services for consumers, businesses, governments, and exports. Analyzing these data shows a more complete picture by complementing traditional trade statistics.
Contact Personnel
-
General InquiriesGlobal Value Chains
-
MediaConnie O'Connell