
News Release
Gross Domestic Product by State, 2nd quarter 2016
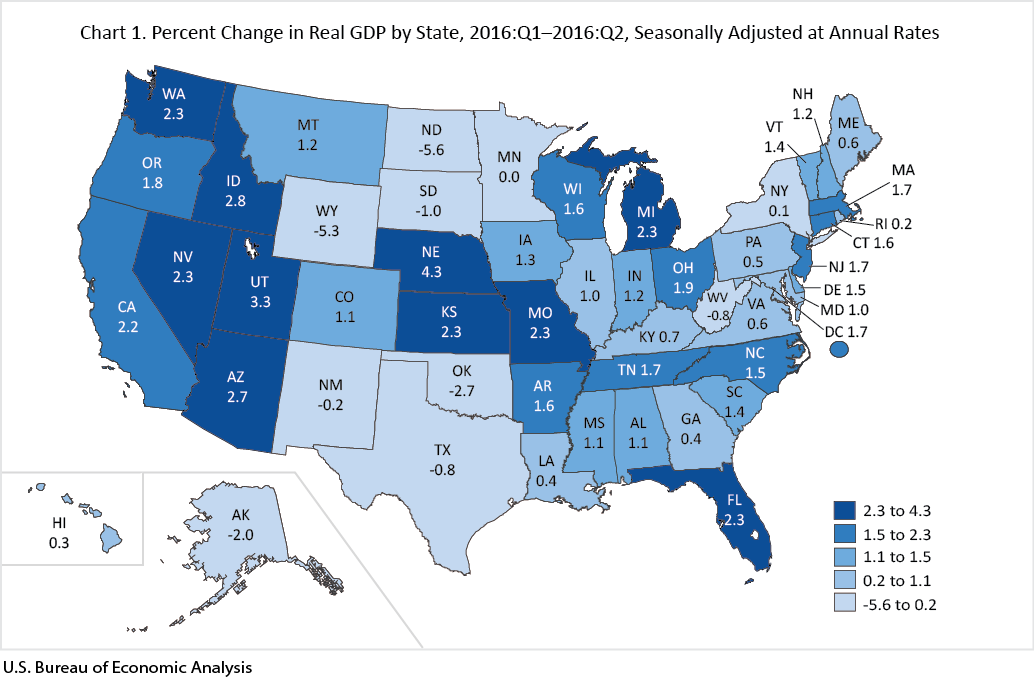
Transportation and Warehousing Led Growth Across States in the Second Quarter
Real gross domestic product (GDP) increased in 41 states and the District of Columbia in the second quarter of 2016, according to statistics on the geographic breakout of GDP released today by the U.S. Bureau of Economic Analysis. Real GDP by state growth ranged from 4.3 percent in Nebraska to –5.6 percent in North Dakota. Transportation and warehousing; health care and social assistance; and professional, scientific, and technical services were the leading contributors to U.S. economic growth in the second quarter.
- Transportation and warehousing grew 14.0 percent in the second quarter of 2016. This industry contributed to growth in 47 states and the District of Columbia and contributed 0.97 percentage point to the 2.3 percent growth in Nevada.
- Health care and social assistance grew 4.7 percent in the second quarter. This industry contributed to growth in every state and the District of Columbia.
- Professional, scientific, and technical services grew 3.7 percent in the second quarter—the ninth consecutive quarter of growth for this industry. This industry contributed to growth in 47 states and the District of Columbia.
Other highlights
- Although agriculture, forestry, fishing, and hunting was not a significant contributor to real GDP growth for the nation, it had an important impact on economic growth in several states. This industry contributed 3.80 percentage points to the 4.3 percent growth in Nebraska—the fastest growing state in the second quarter. By contrast, this industry subtracted more than 2.0 percentage points from real GDP growth in North Dakota and South Dakota, which declined 5.6 percent, and 1.0 percent, respectively.
- Mining declined 20.4 percent for the nation in the second quarter. This industry subtracted 5.13 percentage points from real GDP growth in Wyoming, which declined 5.3 percent, and more than 2.0 percentage points from Alaska, North Dakota, Oklahoma, and West Virginia, which declined 2.0 percent, 5.6 percent, 2.7 percent, and 0.8 percent, respectively.
- Retail trade declined 2.8 percent for the nation in the second quarter. This industry subtracted from real GDP growth in all states, except New Hampshire and the District of Columbia.
Updates to GDP by State
BEA also released revised quarterly GDP by state statistics for 2005:Q1 to 2016:Q1 and revised annual GDP by state statistics for 1997 to 2015. Updates are made each year to incorporate the results of the annual update to the national income and product accounts (July 2016), the annual update to state personal income (September 2016), and the annual update to GDP by industry (November 2016).
This year's annual revision to state personal income introduced two major methodological improvements affecting nonfarm proprietors' income that impacted the GDP by state statistics. These methodological improvements—(1) improved geocoding and editing of source data from IRS Form 1065 (Partnership Returns) and Schedule C of Form 1040 (Sole Proprietor Returns), and (2) an improved method of allocating national control totals to states—were discussed in the July 2016 and October 2016 issues of the Survey of Current Business.
An article in the January 2017 issue of the Survey of Current Business will provide additional information about the update to GDP by state.
Next release — February 2, 2017 at 8:30 A.M. EST for: Gross Domestic Product by State, Third Quarter 2016