
News Release
U.S. International Investment Position, 1st quarter 2016, annual 2015, and annual revisions
First Quarter of 2016
The U.S. net international investment position at the end of the first quarter of 2016 was −$7,525.6 billion (preliminary) as the value of U.S. liabilities exceeded the value of U.S. assets (chart 1, table 1). At the end of the fourth quarter of 2015, the net investment position was -$7,280.6 billion (revised).
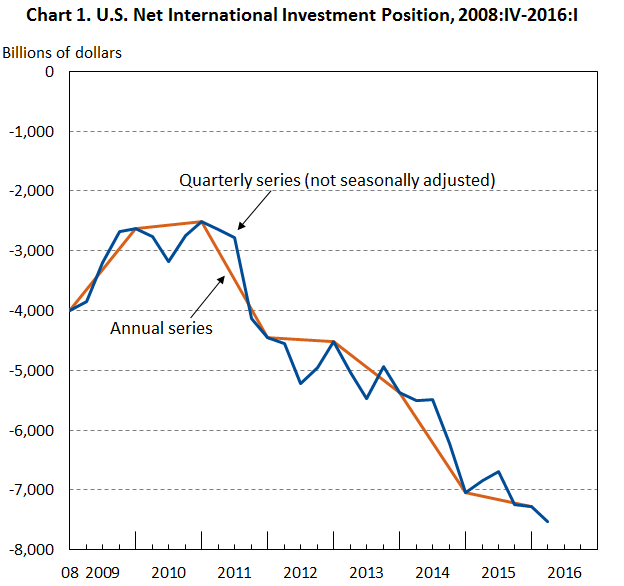
- The net investment position decreased $245.0 billion or 3.4 percent in the first quarter, compared with a decrease of 0.6 percent in the fourth quarter, and an average quarterly decrease of 6.4 percent from the first quarter of 2011 through the third quarter of 2015.
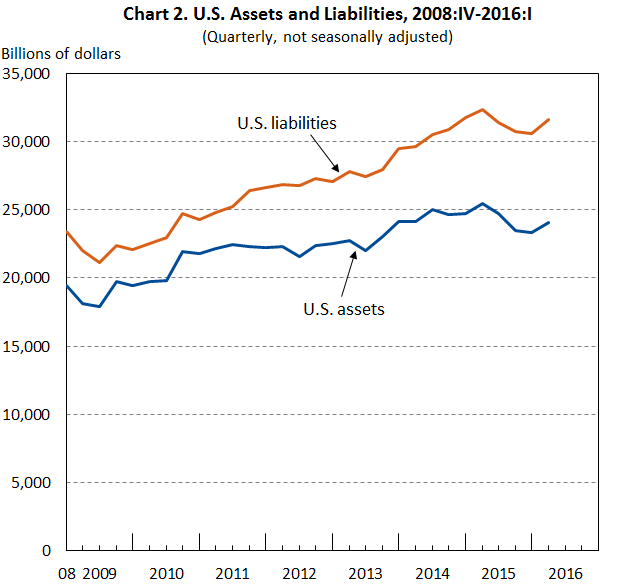
U.S. assets increased $742.1 billion to $24,082.9 billion at the end of the first quarter (chart 2).
- Financial derivatives with a gross positive fair value increased $586.4 billion, mostly in single-currency interest rate contracts.1
- Assets excluding financial derivatives increased $155.7 billion to $21,101.1 billion, reflecting both an appreciation of major foreign currencies against the U.S. dollar that raised the value of U.S. assets in dollar terms and net U.S. acquisition of assets. These increases were partly offset by price decreases on direct investment and portfolio investment assets.
U.S. liabilities increased $987.1 billion to $31,608.5 billion at the end of the first quarter (chart 2).
- Financial derivatives with a gross negative fair value increased $604.5 billion, mostly in single-currency interest rate contracts.
- Liabilities excluding financial derivatives increased $382.7 billion, mostly reflecting an increase in U.S. bond prices that raised the value of portfolio investment liabilities.
Year 2015
The U.S. net international investment position was -$7,280.6 billion (revised) at the end of 2015 compared with -$7,046.1 billion (revised) at the end of 2014 (table 2). The $234.5 billion decrease in the net investment position was mostly due to net financial transactions—net U.S. acquisition of assets excluding financial derivatives less net U.S. incurrence of liabilities excluding financial derivatives plus net transactions in financial derivatives. Other changes in position, which include price changes, exchange-rate changes, and changes in volume and valuation n.i.e., also contributed to the decrease.
Net financial transactions were -$195.2 billion in 2015.
- Net U.S. acquisition of assets excluding financial derivatives was $225.4 billion, reflecting net acquisition of direct investment assets (mostly equity) and portfolio investment assets (mostly equity and investment fund shares) that was partly offset by net withdrawal of deposits abroad and net foreign repayment of loans in other investment.
- Net U.S. incurrence of liabilities excluding financial derivatives was $395.2 billion, reflecting net incurrence of direct investment liabilities (mostly equity) and portfolio investment liabilities (mostly long-term debt) that was partly offset by net U.S. repayment of loans in other investment and by net foreign sales of U.S. equity and investment fund shares.
- Net transactions in financial derivatives were -$25.4 billion.
Net other changes in position were -$39.3 billion.
- Net price changes of $781.4 billion reflected both price appreciation of U.S. assets and price depreciation of U.S. liabilities.
- Net exchange-rate changes of -$1,051.5 billion reflected the depreciation of major foreign currencies against the U.S. dollar that lowered the dollar value of U.S. assets significantly more than the decline in the dollar value of U.S. liabilities.
- Net changes in volume and valuation n.i.e. of $233.7 billion reflected the incorporation of newly available data from the Treasury International Capital reporting system (TIC) on aggregate holdings of long-term securities by U.S. and foreign residents, more complete TIC reporting of nonbanking and banking positions, capital gains and losses from the sale of direct investment assets, and other changes in position that cannot be allocated to price changes or exchange-rate changes.
U.S. assets decreased $1,376.8 billion to $23,340.8 billion at the end of 2015. Financial derivatives with a gross positive fair value decreased $818.8 billion, and assets excluding financial derivatives decreased $558.0 billion. The decrease in assets excluding financial derivatives reflected exchange-rate changes of -$1,141.5 billion that were partly offset by financial transactions of $225.4 billion, price changes of $220.4 billion, and changes in volume and valuation n.i.e. of $137.7 billion.
U.S. assets decreased across all major categories.
- Financial derivatives decreased $818.8 billion to $2,395.4 billion, mostly reflecting a decrease in the value of single-currency interest rate contracts.
- Other investment assets (currency and deposits, loans, insurance technical reserves, and trade credit and advances) decreased $254.5 billion to $3,977.3 billion, reflecting –$270.9 billion in financial transactions mostly due to net withdrawal of deposits abroad and net foreign repayment of loans.
- Direct investment assets at market value decreased $154.8 billion to $6,978.3 billion, reflecting decreases from exchange-rate and price changes that were partly offset by increases from financial transactions, mostly from reinvestment of earnings in equity investment.
- Portfolio investment assets decreased $98.1 billion to $9,606.2 billion, reflecting decreases from exchange-rate changes that were mostly offset by increases from price changes, financial transactions, and changes in volume and valuation n.i.e.
- Reserve assets decreased $50.7 billion to $383.6 billion, largely reflecting decreases from price changes in monetary gold.
U.S. liabilities decreased $1,142.3 billion to $30,621.4 billion at the end of 2015. Financial derivatives with a gross negative fair value decreased $790.5 billion, and liabilities excluding financial derivatives decreased $351.8 billion. The decrease in liabilities excluding financial derivatives reflected price changes of -$561.0 billion, changes in volume and valuation n.i.e. of -$96.0 billion, and exchange-rate changes of -$90.0 billion that were partly offset by financial transactions of $395.2 billion.
Liabilities decreased across all major categories except direct investment.
- Financial derivatives decreased $790.5 billion to $2,338.1 billion, mostly reflecting a decrease in the value of single-currency interest rate contracts.
- Other investment liabilities (currency and deposits, loans, insurance technical reserves, trade credit and advances, and special drawing rights allocations) decreased $302.7 billion to $5,062.5 billion, reflecting –$235.1 billion in financial transactions that were driven by net U.S. repayment of loans.
- Portfolio investment liabilities decreased $242.8 billion to $16,677.0 billion. Decreases from price changes—due to decreases in U.S. equity and bond prices—were partly offset by increases from financial transactions, which reflected net foreign purchases of U.S. debt securities that exceeded net foreign sales of U.S. equity and investment fund shares.
- Direct investment liabilities at market value increased $193.8 billion to $6,543.8 billion, reflecting increases from financial transactions, mostly from equity investment, that were partly offset by decreases from price changes.
Annual Revisions
The U.S. net international investment position statistics released today have been revised from the first quarter of 2012 to the fourth quarter of 2015 to reflect newly available and revised source data and an improved methodology for estimating transactions in foreign-currency denominated assets and liabilities. Key changes introduced in this annual revision are summarized below and in table 3.
Newly available and revised source data include 1) the results from BEA’s 2012 Benchmark Survey of Foreign Direct Investment in the United States and newly available and revised data from BEA’s quarterly and annual direct investment surveys, 2) the Treasury International Capital (TIC) monthly reports and annual surveys, and 3) other U.S. government administrative data.
The improved estimation methodology consists of a refinement to the methodology for estimating transactions in foreign-currency denominated deposits, loans, short-term securities, and negotiable certificates of deposit. The improved methodology is reflected in revised statistics for portfolio and other investment financial asset and liability transactions and exchange-rate changes.
A more detailed discussion of the revisions to source data for the U.S. International Investment Position Accounts and the U.S. International Transactions Accounts, including a discussion of the refinement of the methodology for estimating transactions in foreign-currency denominated assets and liabilities, will be provided in the July issue of the Survey of Current Business.
For yearend 2015, the net investment position was revised upward by $76.1 billion to -$7,280.6 billion from -$7,356.8 billion. U.S. assets were revised upward by $132.5 billion and U.S. liabilities were revised upward by $56.3 billion (table 3).
****
1 A derivatives contract with a positive fair value represents the amount that a foreign resident would have to pay to a U.S. counterparty if the contract were terminated or settled. A contract with a negative fair value represents the amount that a U.S. resident would have to pay to a foreign counterparty if the contract were terminated or settled. The gross positive (negative) fair value is the sum of all contracts with positive (negative) fair values. Fair values differ from notional values, which are the underlying amounts used to calculate payments on contracts.
****
The first-quarter statistics in this release are preliminary and will be revised on September 27, 2016.
****
Next release: U.S. International Investment Position, End of the Second Quarter of 2016
September 27, 2016 at 8:30 A.M. EDT
****