
News Release
Arts and Cultural Production Satellite Account, U.S. and States 2014
Arts and Culture Grow for Third Straight Year
New State Data Show Employment in These Industries Rises in 24 States
Arts and cultural economic activity nationwide grew an inflation-adjusted 1.9 percent in 2014, according to new statistics released by the Bureau of Economic Analysis. That compares with a 2.4 percent increase in real value added from all arts and culture industries for 2013 (table 1). Arts and cultural economic activity accounted for 4.2 percent of gross domestic product (GDP), or $729.6 billion, in 2014 (table 2).
For the first time, the Arts and Cultural Production Satellite Account includes state-level estimates of employment and compensation.
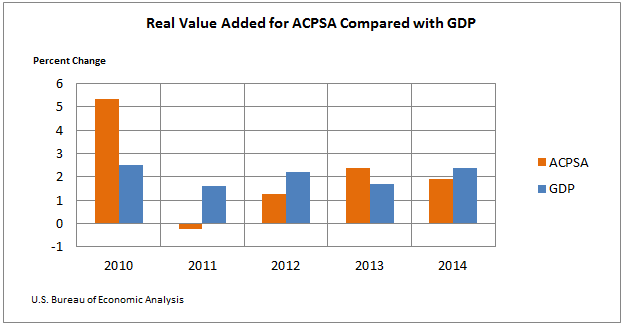
Information services and design services were the leading contributors to the nationwide growth in 2014. Core arts and cultural production industries, including performing arts, design services, fine arts education and education services, grew 3.2 percent. Supporting arts and cultural production industries, including art support services and information services, increased 1.6 percent. Real Value Added for Arts and Culture Industries Nationwide
Real Value Added for Arts and Culture Industries Nationwide
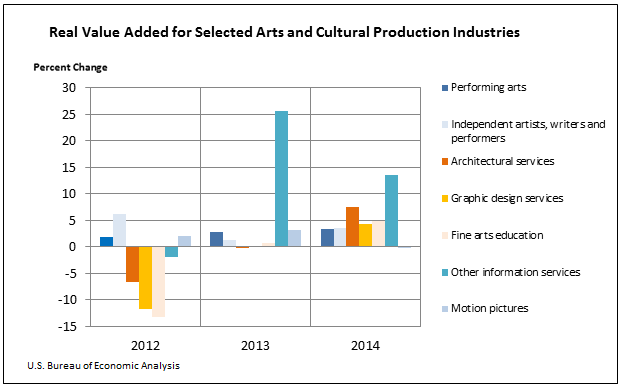
- For the other information services industry group, which includes internet publishing, internet broadcasting, and web search portals, real value added increased 13.6 percent in 2014, after increasing 25.6 percent in 2013.
- Architectural services increased 7.6 percent, after decreasing 0.2 percent in 2013. This was the largest increase since 2007.
- Performing arts companies increased 1.9 percent, after being unchanged in 2013.
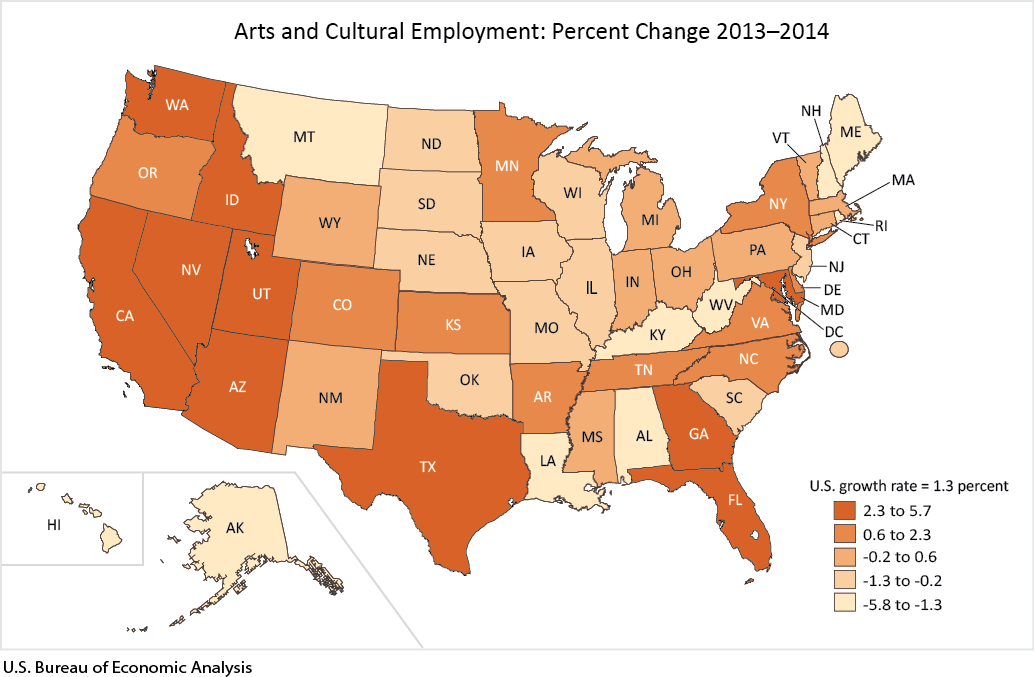
National and State Employment. Arts and cultural employment nationwide grew 1.3 percent in 2014, the same pace reported for 2013. The total number of arts and culture jobs was 4.80 million in 2014, which accounted for 3.3 percent of all jobs in the United States.
In core arts and cultural production industries, nationwide employment grew 3.8 percent in 2014 to a total of 1.02 million jobs. Performing arts and design services accounted for about 75 percent of all employment in the core arts and cultural production industries in 2014 (table 7).
In supporting arts and cultural production industries, nationwide employment grew 0.5 percent in 2014 to a total of 3.58 million jobs. Art support services and information services were the two largest of these industries. Art support services, including government, accounted for 1.19 million jobs; information services, including publishing, motion pictures, and broadcasting, accounted for 1.18 million jobs in 2014.
Today's release marked the first time BEA produced statistics on arts and cultural employment as well as compensation for all 50 states and the District of Columbia. Those state-level statistics show that 24 states had positive employment growth in arts and cultural industries in 2014. Growth across all states ranged from a low of -5.8 percent in Montana to a high of 5.7 percent in Washington (table 6).
Arts and cultural employment grew faster in Washington than in any other state in 2014. Core arts and cultural production industries grew 3.1 percent, while supporting arts and cultural production industries grew 6.2 percent. Washington had 154,230 jobs related to arts and culture in 2014, representing 4.2 percent of all jobs in the state. Average compensation for arts and cultural jobs in Washington was $111,890 in 2014. Software design and online retailers are features of ACPSA employment in this state.
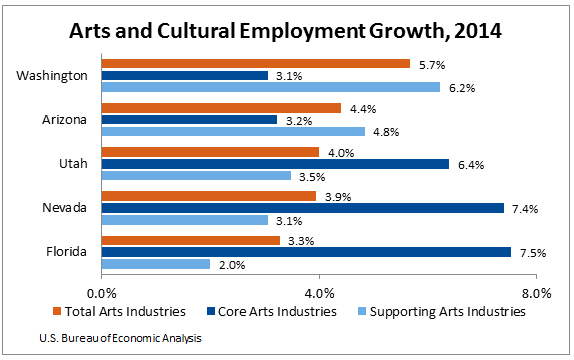
After Washington, the states with the fastest growth in arts and cultural employment in 2014 were:
- Arizona, with 4.4 percent arts and culture employment growth. The state had 85,976 jobs related to arts and culture in 2014, representing 3.0 percent of jobs in the state. Average compensation for arts and cultural jobs in Arizona was $54,004 in 2014.
- Utah, with 4.0 percent employment growth. Utah had 55,965 jobs related to arts and culture in 2014, representing 3.9 percent of jobs in the state. Average compensation of arts and cultural jobs in Utah was $52,799 in 2014.
- Nevada, with 3.9 percent growth. Nevada had 40,323 jobs related to arts and culture in 2014, accounting for 3.0 percent of jobs in the state. Average compensation of arts and cultural jobs in Nevada was $67,042 in 2014.
- Florida, with 3.3 percent growth. Florida had 236,557 jobs related to arts and culture in 2014, representing 2.8 percent of jobs in the state. Average compensation of arts and cultural jobs in Florida was $59,326 in 2014.
National Real Gross Output. BEA's Arts and Cultural Production Satellite Account also includes a measure of real gross output for arts and culture industries nationwide. According to this measure, total inflation-adjusted spending on all arts and cultural goods and services reached $1.1 trillion in 2014 (table 5).
Gross output is principally a measure of an industry's sales or receipts, which can include sales to final users in the economy (GDP) or sales to other industries (intermediate inputs). Gross output can also be measured as the sum of an industry's value added and intermediate inputs.
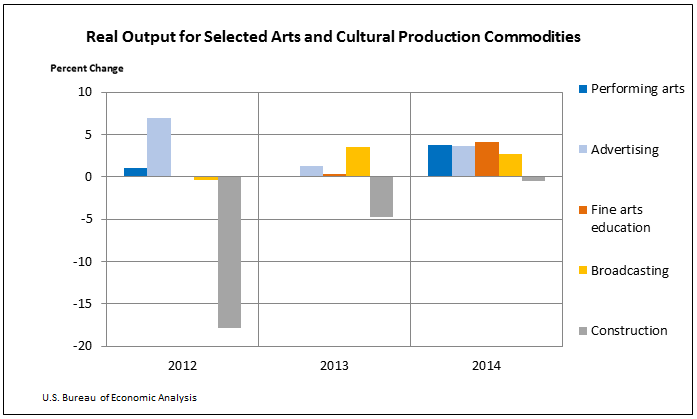
- Real gross output increased 3.0 percent in 2014, after increasing 1.7 percent increase in 2013. Design services was the leading contributor to that growth, increasing 4.5 percent (table 3).
- Information services was the second leading contributor to the growth in real gross output, increasing 3.1 percent, after increasing 3.9 percent in 2013.
- Performing arts output grew at a faster pace in 2014, increasing 3.7 percent, up from 0.1 percent in 2013. Growth was widespread, including gains in music, opera, and theater.
Updates to the Arts and Cultural Production Satellite Account. BEA also released revised national estimates of output, value added and intermediate inputs for 2012 and 2013. The updated statistics incorporate the most recent data from BEA's Industry Economic Accounts.
Important Notice. BEA's Arts and Cultural Production Satellite Account (ACPSA) is supported by funding from the National Endowment for the Arts (NEA).
This release makes available, for the first time, prototype estimates of ACPSA state employment and compensation for 2001 to 2014. The estimates are being released for evaluation and comment, and BEA requests suggestions for refinement and improvement. Comments can be addressed to artsandculture@bea.gov.