
News Release
These data have been superseded. Please see our latest releases for current estimates and contact information.
Gross Domestic Product, 2nd quarter 2017 (advance estimate), and annual update
Real gross domestic product increased at an annual rate of 2.6 percent in the second quarter of 2017
(table 1), according to the "advance" estimate released by the Bureau of Economic Analysis. In the first
quarter, real GDP increased 1.2 percent (revised).

The Bureau emphasized that the second-quarter advance estimate released today is based on source
data that are incomplete or subject to further revision by the source agency (see “Source Data for the
Advance Estimate” on page 3). The "second" estimate for the second quarter, based on more complete
data, will be released on August 30, 2017.

The increase in real GDP in the second quarter reflected positive contributions from personal
consumption expenditures (PCE), nonresidential fixed investment, exports, and federal government
spending that were partly offset by negative contributions from private residential fixed investment,
private inventory investment, and state and local government spending. Imports, which are a
subtraction in the calculation of GDP, increased (table 2).
Box___
Annual Update of the National Income and Product Accounts
The estimates released today reflect the results of the annual update of the national income and
product accounts (NIPAs) in conjunction with the "advance" estimate of GDP for the second quarter of
2017. The update covers the first quarter of 2014 through the first quarter of 2017. For more
information, see information on the "2017 Annual Update" on BEA’s Web site. Additionally, the August
Survey of Current Business will contain an article that describes the results in detail.
______
The acceleration in real GDP growth in the second quarter reflected a smaller decrease in private
inventory investment, an acceleration in PCE, and an upturn in federal government spending. These
movements were partly offset by a downturn in residential fixed investment and decelerations in
exports and in nonresidential fixed investment.
Current-dollar GDP increased 3.6 percent, or $169.0 billion, in the second quarter to a level of $19,226.7
billion. In the first quarter, current-dollar GDP increased 3.3 percent (revised), or $152.2 billion (table 1
and table 3).
The price index for gross domestic purchases increased 0.8 percent in the second quarter, compared
with an increase of 2.6 percent in the first quarter (revised) (table 4). The PCE price index increased 0.3
percent, compared with an increase of 2.2 percent. Excluding food and energy prices, the PCE price
index increased 0.9 percent, compared with an increase of 1.8 percent (appendix table A).
Personal Income (table 10)
Current-dollar personal income increased $118.9 billion in the second quarter, compared with an
increase of $217.6 billion in the first quarter (revised). The deceleration in personal income primarily
reflected decelerations in wages and salaries, in government social benefits, in nonfarm proprietors’
income, and in rental income, and downturns in personal interest income and in farm proprietors’
income. These movements were offset by an upturn in personal dividend income.
Disposable personal income increased $122.1 billion, or 3.5 percent, in the second quarter, compared
with an increase of $176.3 billion, or 5.1 percent, in the first quarter (revised). Real disposable personal
income increased 3.2 percent, compared with an increase of 2.8 percent.
Personal saving was $546.8 billion in the second quarter, compared with $553.0 billion in the first
quarter (revised). The personal saving rate -- personal saving as a percentage of disposable personal
income -- was 3.8 percent in the second quarter, compared with 3.9 percent in the first.
Source Data for the Advance Estimate
Information on the source data in the advance estimate is provided in a Technical Note that is posted
with the news release on BEA’s Web site. A detailed "Key Source Data and Assumptions" file is also
posted for each release. For information on updates to GDP, see the “Additional Information” section
that follows.
Annual Update of the National Income and Product Accounts
Updated estimates of the national income and product accounts (NIPAs), which are usually made each
July, incorporate newly available and more comprehensive source data, as well as improved estimation
methodologies. This year, the notable revisions primarily reflect the incorporation of newly available
and revised source data. The timespan of the revisions is the first quarter of 2014 through the first
quarter of 2017. The reference year remains 2009.
With the release of the updated statistics, select NIPA tables will be available on BEA’s Web site
(www.bea.gov). Shortly after the GDP release, BEA will post a table on its Web site showing the major
current-dollar revisions and their sources for each component of GDP, national income, and personal
income. Additionally, the August 2017 Survey of Current Business will contain an article describing these
revisions.
Updates for the first quarter of 2017
For the first quarter of 2017, real GDP is now estimated to have increased 1.2 percent; in the previously
published estimates, first-quarter GDP was estimated to have increased 1.4 percent. The 0.2-percentage
point downward revision to the percent change in first-quarter real GDP reflected downward revisions
to nonresidential fixed investment, to private inventory investment, to residential fixed investment, and
to federal government spending, and an upward revision to imports. These movements were partly
offset by upward revisions to PCE, to state and local government spending, and to exports.
Real GDI is now estimated to have increased 2.6 percent in the first quarter; in the previously published
estimates, first-quarter GDI was estimated to have increased 1.0 percent.
First Quarter 2017
Previous Estimate Revised
(Percent change from preceding quarter)
Real GDP 1.4 1.2
Current-dollar GDP 3.4 3.6
Real GDI 1.0 2.6
Average of GDP and GDI 1.2 1.9
Gross domestic purchases price index 2.5 2.6
PCE price index 2.4 2.2
Real GDP (Tables 1A, 1B, and 2A)
The updated statistics largely reflect the incorporation of newly available and revised source data (see
the box below) and improvements to existing methodologies.
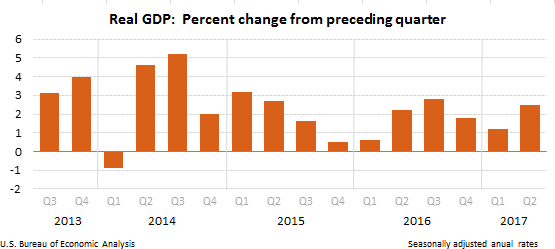
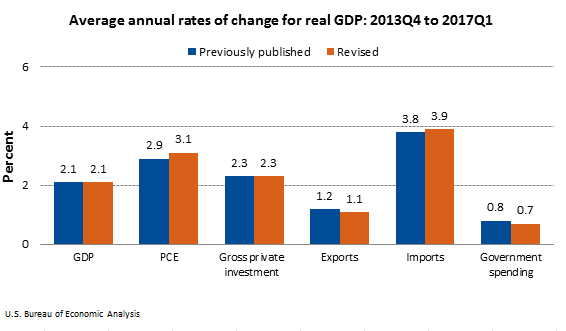
* From 2013 to 2016, real GDP increased at an average annual rate of 2.3 percent; in the
previously published estimates, real GDP had increased at an average annual rate of 2.2 percent.
From the fourth quarter of 2013 to the first quarter of 2017, real GDP increased at an average
annual rate of 2.1 percent, the same as previously published.
*	The percent change in real GDP was revised up 0.2 percentage point for 2014, was revised up
        0.3 percentage point for 2015, and was revised down 0.1 percentage point for 2016.

    o       For 2014, upward revisions to nonresidential fixed investment, inventory investment,
            and state and local government spending were partly offset by an upward revision to
            imports.

    o       For 2015, upward revisions to personal consumption expenditures (PCE), inventory
            investment, exports, and nonresidential fixed investment were partly offset by
            downward revisions to state and local government spending and to residential fixed
            investment, and by an upward revision to imports.

    o       For 2016, downward revisions to exports, federal government spending, and inventory
            investment were partly offset by an upward revision to state and local government
            spending.

*	The revisions to the annual estimates typically reflect partly offsetting revisions to the quarters
        within the year.

    o       For 2014, the annual rate of change in GDP was revised up 0.3 percentage point for the
            first quarter, 0.6 percentage point for the second quarter, and 0.2 percentage point for
            the third quarter; these upward revisions were partly offset by a downward revision of
            0.3 percentage point for the fourth quarter.

    o       For 2015, upward revisions of 1.2 percentage points for the first quarter and 0.1
            percentage point for the second quarter were partly offset by downward revisions of 0.4
            percentage point for both the third and fourth quarters.

    o       For 2016, downward revisions of 0.2 percentage point for the first quarter, 0.7
            percentage point for the third quarter, and 0.3 percentage point for the fourth quarter
            were partly offset by an upward revision of 0.8 percentage point for the second quarter.

*	For the first quarter of 2014 through the first quarter of 2017, the average revision (without
        regard to sign) in the percent change in real GDP was 0.4 percentage point.  The revisions did
        not change the direction of the change in real GDP (increase or decrease) for any of the
        quarters.

*	For the period of economic expansion from the second quarter of 2009 to the first quarter of
        2017, real GDP increased at an average annual rate of 2.1 percent, the same as previously
        published.

*	Current-dollar GDP was revised up for all three years: $34.5 billion, or 0.2 percent, for 2014;
        $84.1 billion, or 0.5 percent, for 2015; and $55.4 billion, or 0.3 percent, for 2016.


Gross domestic income (GDI) and the statistical discrepancy (Tables 1A and 1B)

*	From 2013 to 2016 real GDI increased at an average annual rate of 2.3 percent, unrevised from
        the previous estimate.  From the fourth quarter of 2013 to the first quarter of 2017, real GDI
        increased at an average annual rate of 2.2 percent; in the previously published estimates, real
        GDI increased at an average annual rate of 2.1 percent.

*	The statistical discrepancy is current-dollar GDP less current-dollar GDI.  GDP measures final
        expenditures -- the sum of consumer spending, private investment, net exports, and
        government spending.  GDI measures the incomes earned in the production of GDP.  In concept,
        GDP is equal to GDI.  In practice, they differ because they are estimated using different source
        data and different methods.

*	The statistical discrepancy as a percentage of GDP was revised up from -1.5 percent to -1.3
        percent for 2014, was unrevised at -1.4 percent for 2015, and was revised up from -1.3 percent
        to -0.8 percent for 2016.

*	The average of GDP and GDI is a supplemental measure of U.S. economic activity. In real, or
        inflation-adjusted, terms this measure increased at an average annual rate of 2.3 percent from
        2013 to 2016, the same as previously published.


Price measures (Table 4A)

*	Gross domestic purchases - From the fourth quarter of 2013 to the first quarter of 2017, the
        average annual rate of increase in the price index for gross domestic purchases was 1.2 percent,
        the same as previously published.

*	Personal consumption expenditures - From the fourth quarter of 2013 to the first quarter of
        2017, the average annual rate of increase in the price index for PCE was 1.2 percent, 0.1
        percentage point higher than the previously published estimates. The increase in the “core” PCE
        price index, which excludes food and energy, was 1.6 percent, the same as previously published.


Income and saving measures (Table 1B)

*	National income was revised down $9.9 billion, or 0.1 percent, for 2014, was revised up $74.3
        billion, or 0.5 percent, for 2015, and was revised down $50.0 billion, or 0.3 percent, for 2016.

    o       For 2014, downward revisions to proprietors’ income and corporate profits were partly
            offset by upward revisions to taxes on production and imports and rental income of
            persons.

    o       For 2015, upward revisions to net interest, corporate profits, taxes on production and
            imports, and supplements to wages and salaries were partly offset by a downward
            revision to proprietors’ income.

    o       For 2016, downward revisions to wages and salaries, proprietors’ income, supplements
            to wages and salaries, and corporate profits were partly offset by upward revisions to
            net interest, taxes on production and imports, and the current surplus of government
            enterprises.

*	Corporate profits was revised down $11.5 billion, or -0.5 percent, for 2014, was revised up $29.4
        billion, or 1.4 percent, for 2015, and was revised down $12.4 billion, or 0.6 percent, for 2016.

*	Personal income was revised up $8.5 billion, or 0.1 percent, for 2014, was revised up $94.5
        billion, or 0.6 percent, for 2015, and was revised down $58.0 billion, or 0.4 percent, for 2016.

*	From 2013 to 2016, the average annual rate of growth of real disposable personal income was
        revised down 0.2 percentage point from 3.2 percent to 3.0 percent.

*	The personal saving rate (personal saving as a percentage of disposable personal income) was
        revised up from 5.6 percent to 5.7 percent for 2014, was revised up from 5.8 percent to 6.1
        percent for 2015, and was revised down from 5.7 percent to 4.9 percent for 2016.


New and revised source data

The updated statistics incorporated data from the following major federal statistical sources:

Agency                                      Data                                     Years Covered and Vintage

Census Bureau                       Annual surveys of wholesale trade               2014 (revised), 2015 (new)
                                    Annual surveys of retail trade                  2014 (revised), 2015 (new)
                                    Annual survey of manufactures                   2014 (revised), 2015 (new)
                                    Monthly indicators of manufactures,
                                      merchant wholesale trade, and retail trade    2014–2016 (revised)
                                    Service annual survey                           2014 and 2015 (revised), 2016 (new)
                                    Annual surveys of state and local
                                    government finances                             Fiscal year (FY) 2014 (revised), FY 2015 (new)

                                    Monthly survey of construction spending
                                      (value put in place)                          2014–2016 (revised)
                                    Quarterly services survey                       2014–2016 (revised)
                                    Current population survey/housing vacancy
                                      survey                                        2014 and 2015 (revised), 2016 (new)

Office of Management
  and Budget                        Federal Budget                                  Fiscal years 2016 and 2017

Internal Revenue Service            Tabulations of tax returns for corporations     2014 (revised), 2015 (new)
                                    Tabulations of tax returns for sole
                                      proprietorships and partnerships              2015 (new)

BLS                                 Quarterly census of employment and wages        2014–2016 ( revised)
                                    Survey of occupational employment               2016 (new)

Department of
Agriculture                         Farm statistics                                 2014–2016 (revised)

BEA                                 International transactions accounts             2014-2016 (revised)


Changes in methodology and presentation

The annual update also incorporated improvements to estimating methodologies and to the
presentation of the NIPA estimates, including the following:

*	Estimates for consumer spending incorporated improved allocations of industry-based retail
        sales to consumer goods, including increased use of retail scanner data and the Census Bureau’s
        E-Commerce Report.

*	The price index used to deflate fixed investment in prepackaged software is now based on a
        more representative Bureau of Labor Statistics Producer Price Index (PPI). In the previously
        published estimates, the BEA price for prepackaged software was based on the PPI for
        “Application software publishing.” Beginning with this annual update, BEA will use the PPI for
        “Software publishing, except games” that includes both applications and systems software
        publishing.

*	Publication of key source data and assumptions that are used to estimate quarterly GDP is
        updated and accelerated. Beginning with this annual update, BEA will post this information with
        each GDP release. (Previously, BEA released this information after the monthly personal income
        and outlays release, usually the business day following the GDP release.) Certain monthly data
        will continue to be released with the monthly personal income and outlays release. Because
        quarterly key source data and assumptions will now be available on the day of the GDP release,
        BEA will no longer publish Technical Note Table A.


                                          *          *          *

                               Next release:  August 30, 2017 at 8:30 A.M. EDT
                         Gross Domestic Product:  Second Quarter 2017 (Second Estimate)
                         Corporate Profits:  Second Quarter 2017 (Preliminary Estimate)

                                          *          *          *