
News Release
Personal Consumption Expenditures by State, 2016
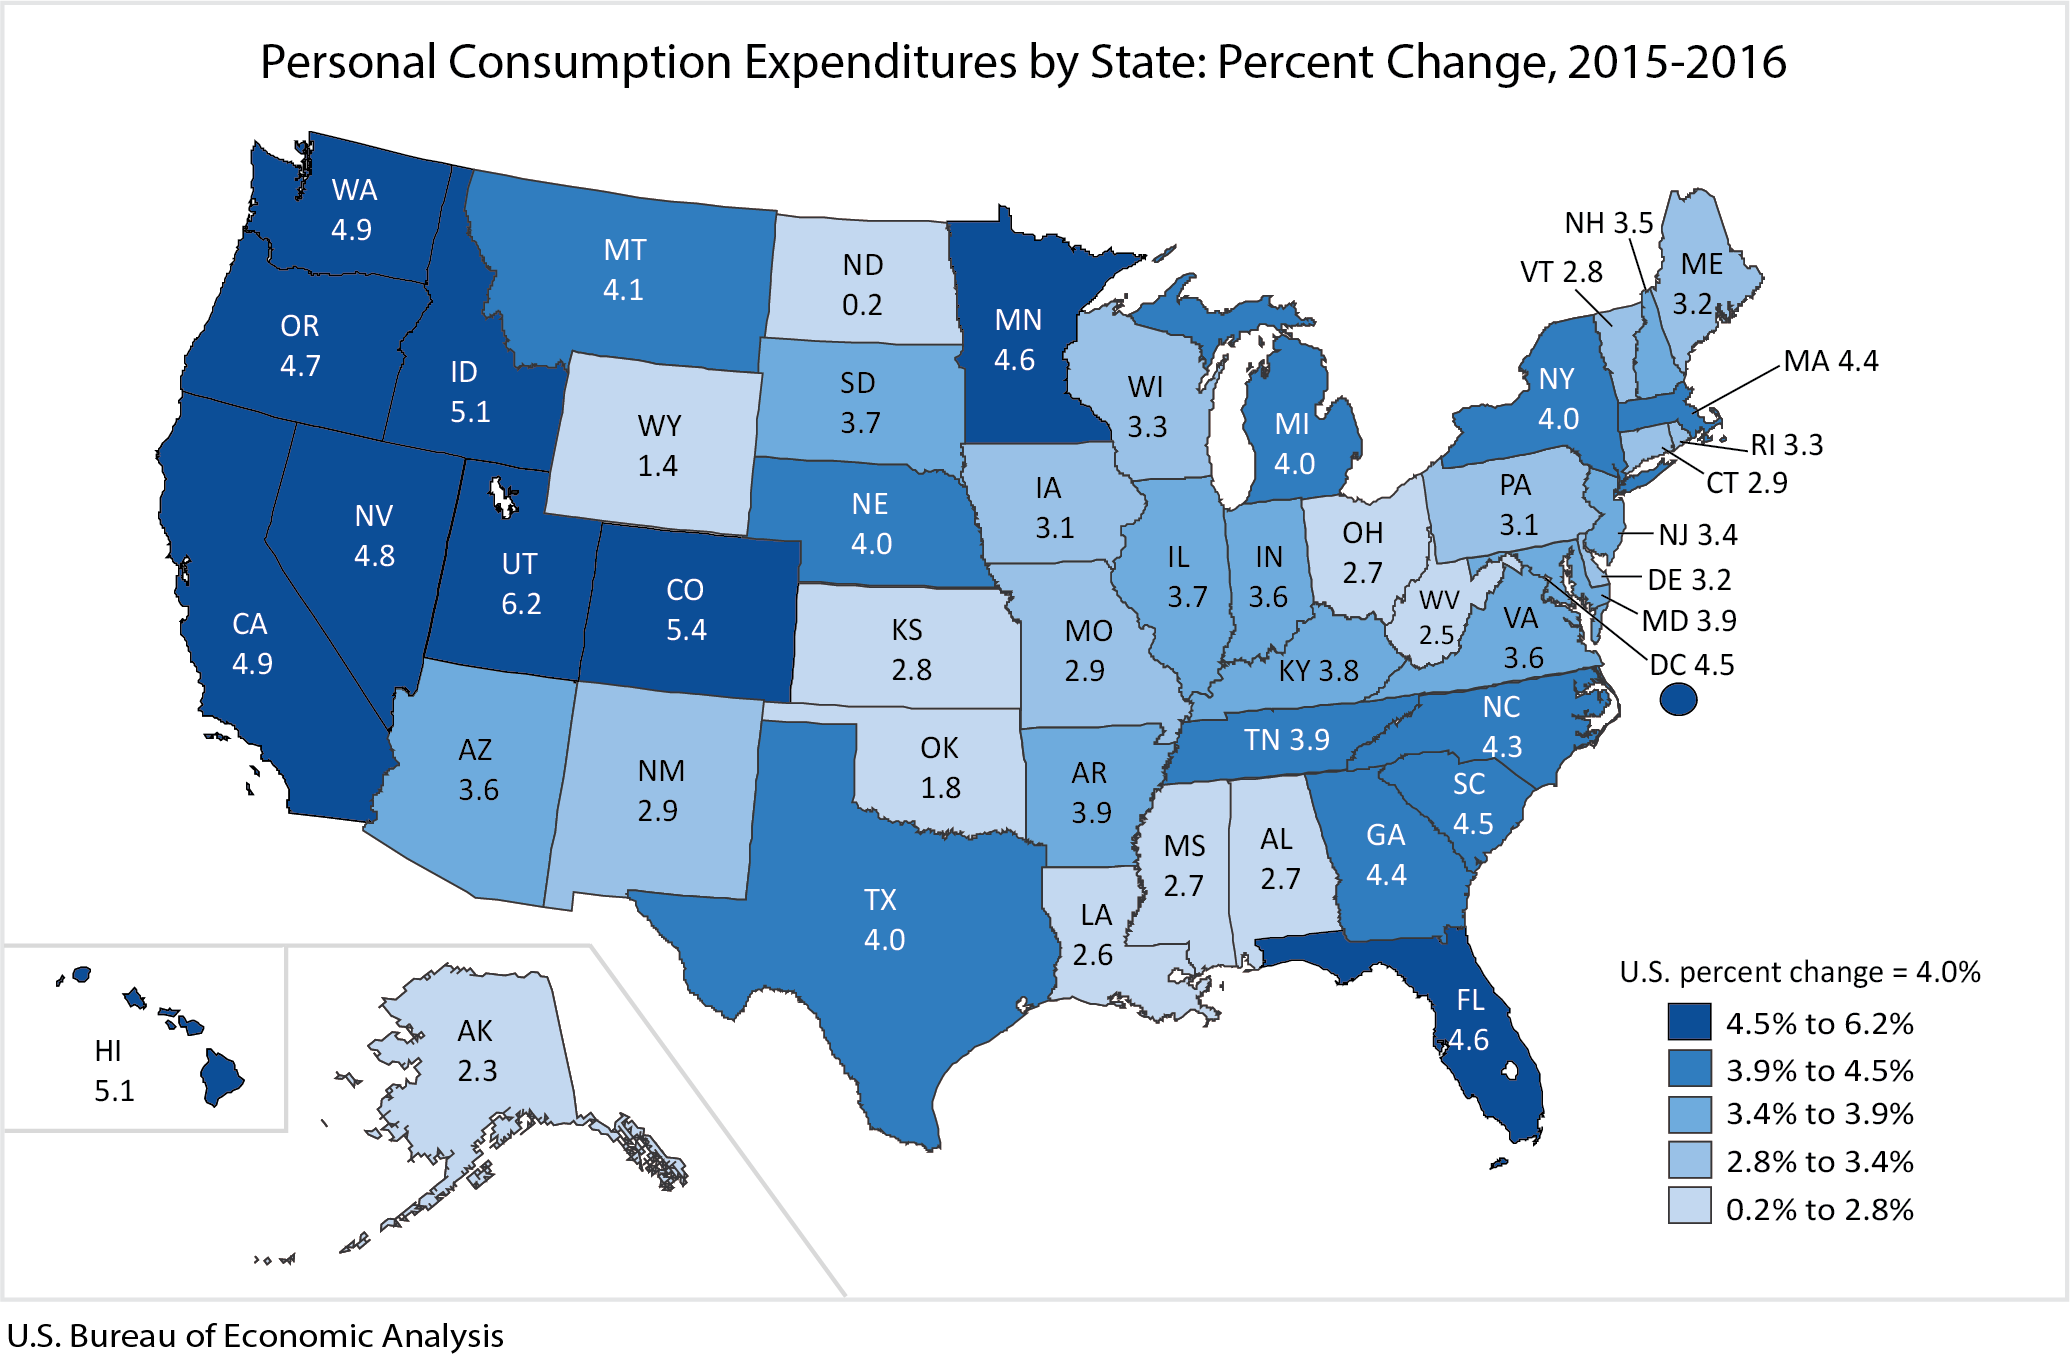
State personal consumption expenditures (PCE) grew on average 4.0 percent in 2016, the same rate as in 2015 (table 1), according to statistics released today by the Bureau of Economic Analysis. In 2016, PCE growth ranged from 0.2 percent in North Dakota to 6.2 percent in Utah.
After Utah, the states with the fastest growth in PCE were Colorado, Hawaii, and Idaho. Utah and Colorado were also among the fastest growing states in 2015. After North Dakota, the states with the slowest PCE growth were Wyoming, Oklahoma, and Alaska.
Category growth in PCE by state. In 2016, growth in housing and utilities and in health care were the leading contributors to national PCE growth (table 3). These categories grew 4.3 percent and 5.0 percent, respectively (table 2). Spending on housing and utilities and health care were also the leading contributors to PCE growth in most states, including the four fastest growing states.
- Utah and Colorado experienced above average growth in housing and utilities expenditures at 5.0 percent and 5.6 percent, respectively.
- Utah, Colorado, Hawaii, and Idaho experienced above average growth in health care expenditures at 9.6 percent, 6.7 percent, 7.5 percent, and 7.8 percent, respectively.
Gasoline and other energy goods was the only category that subtracted from national PCE growth. Expenditures on gasoline and other energy goods declined on average 10.3 percent. Spending on gasoline and other energy goods declined in every state and subtracted the most from growth among the slowest growing states. North Dakota, Wyoming, and Alaska experienced larger than average declines in this expenditure category, 22.1 percent, 14.8 percent, and 12.6 percent, respectively.
Per capita PCE by state in 2016. Across all states and the District of Columbia, per capita PCE was $39,664 (table 4). Per capita PCE by state ranged from a high of $51,981 in Massachusetts to a low of $30,200 in Mississippi. Per capita PCE in the District of Columbia was $56,843.
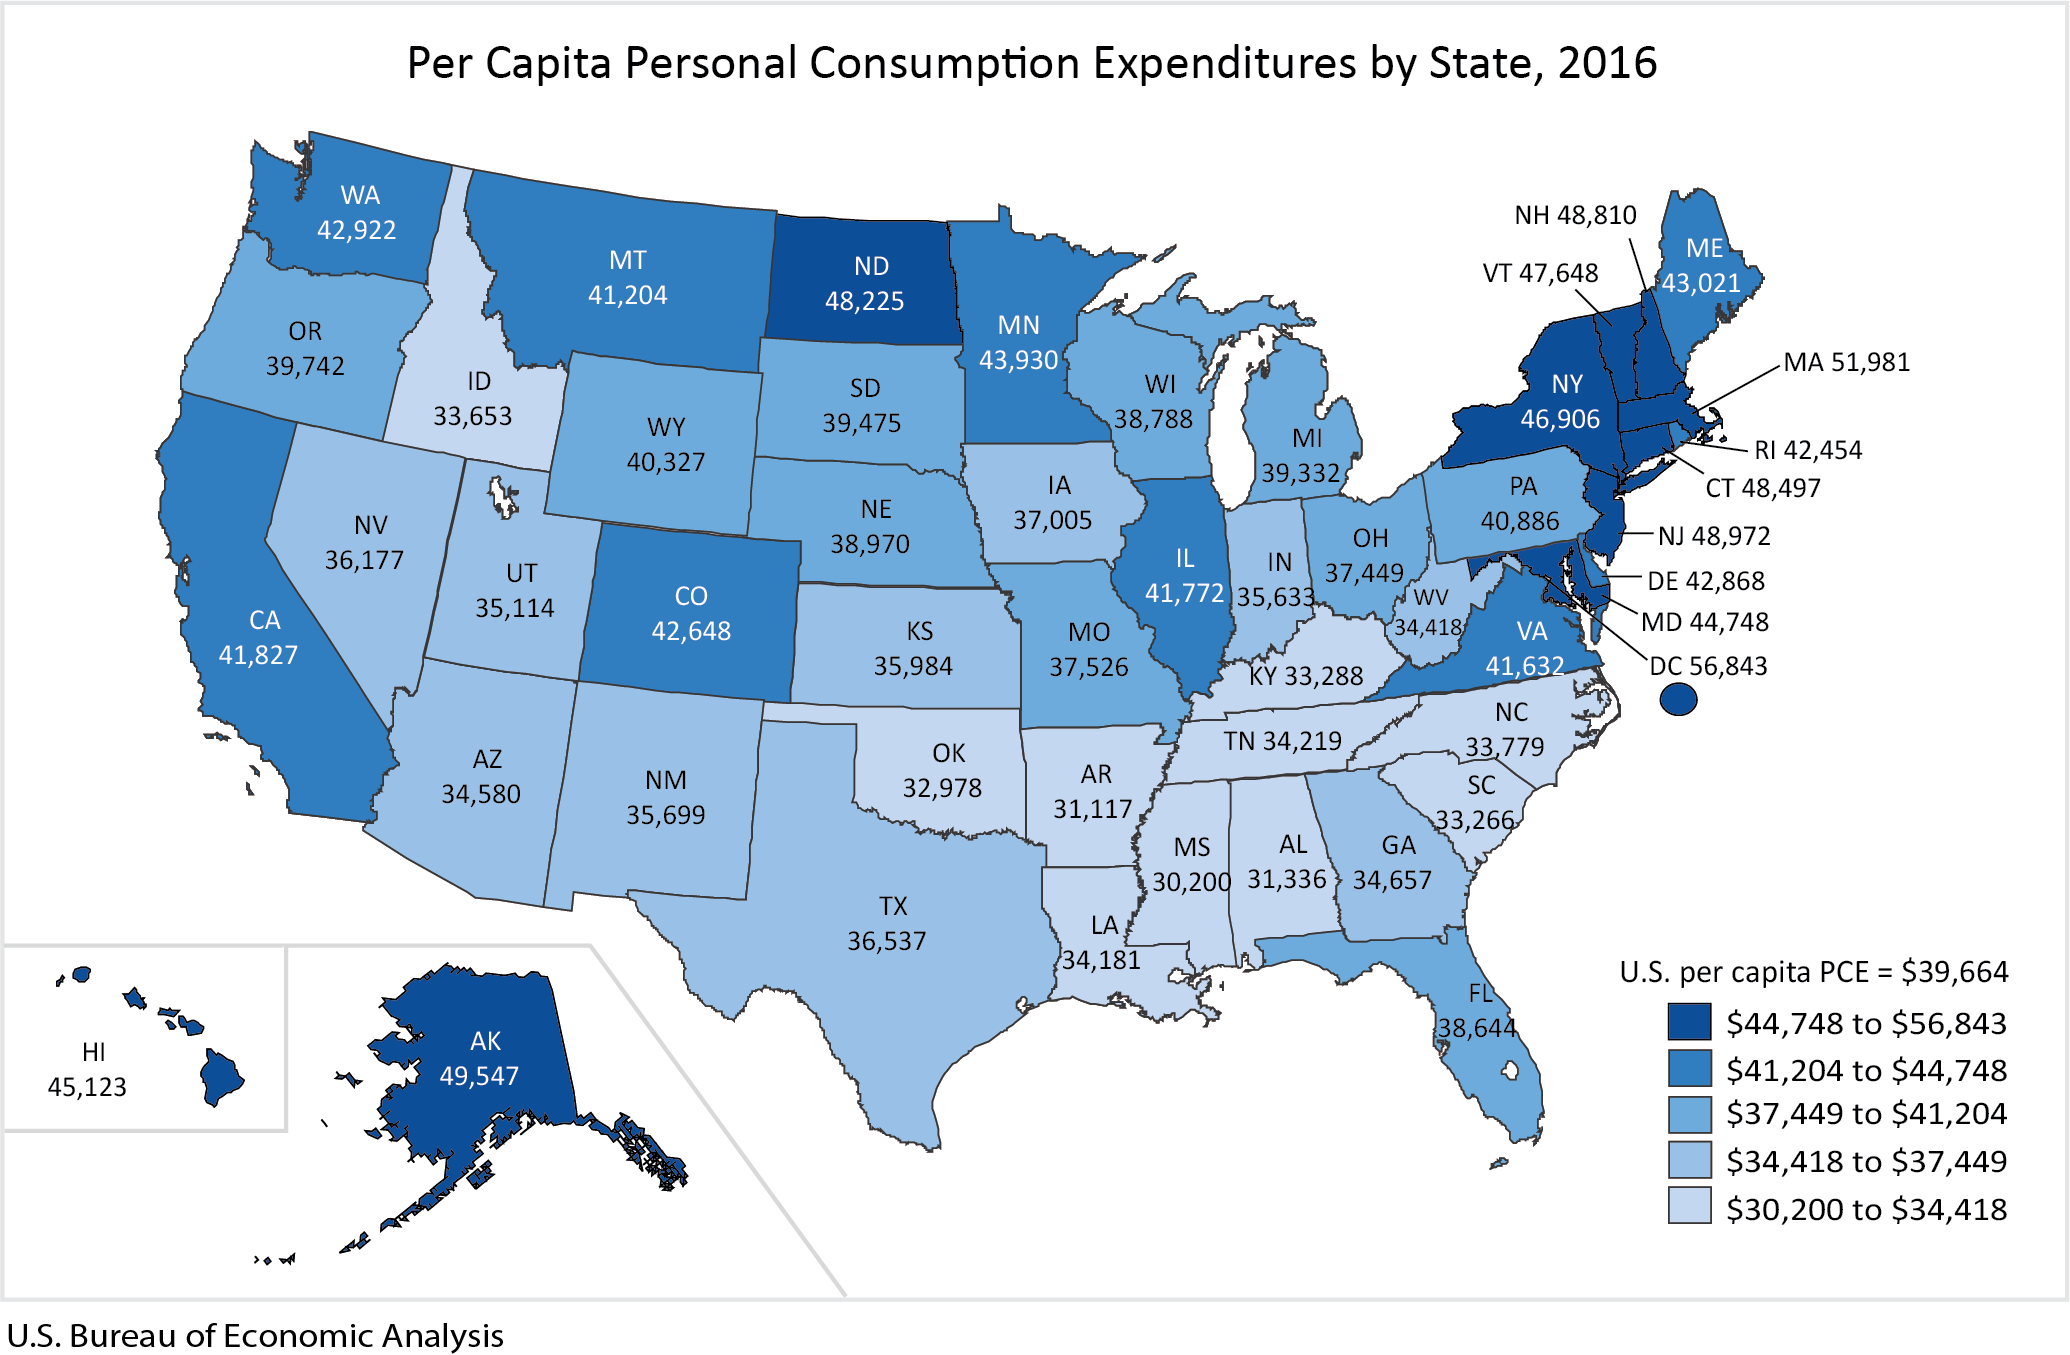
- After Massachusetts, the states with the highest per capita PCE were Alaska, New Jersey, and New Hampshire. After Mississippi, the states with the lowest per capita PCE were Arkansas, Alabama, and Oklahoma.
- Massachusetts, Alaska, New Jersey, and New Hampshire had above average per capita spending on housing and utilities, health care, and food and beverages purchased for off-premises consumption. Alaska and New Hampshire also had above average per capita spending on gasoline and other energy goods.
- Mississippi, Arkansas, Alabama, and Oklahoma were among the states with the lowest per capita spending on housing and utilities and food and beverages purchased for off-premises consumption. These states also had below average per capita spending on health care, but above average per capita spending on gasoline and other energy goods.
More information on per capita spending for these categories can be found in the supplemental maps that accompany this release.
Updates to Personal Consumption Expenditures by State. Today, BEA also released revised annual estimates of personal consumption expenditures by state for 2014 and 2015. Updates were made to incorporate the results of the 2017 annual update of the national income and product accounts and newly available and revised state source data.
Next release: October 4, 2018 – Personal Consumption Expenditures by State, 2017.