
News Release
Personal Consumption Expenditures by State, 2017
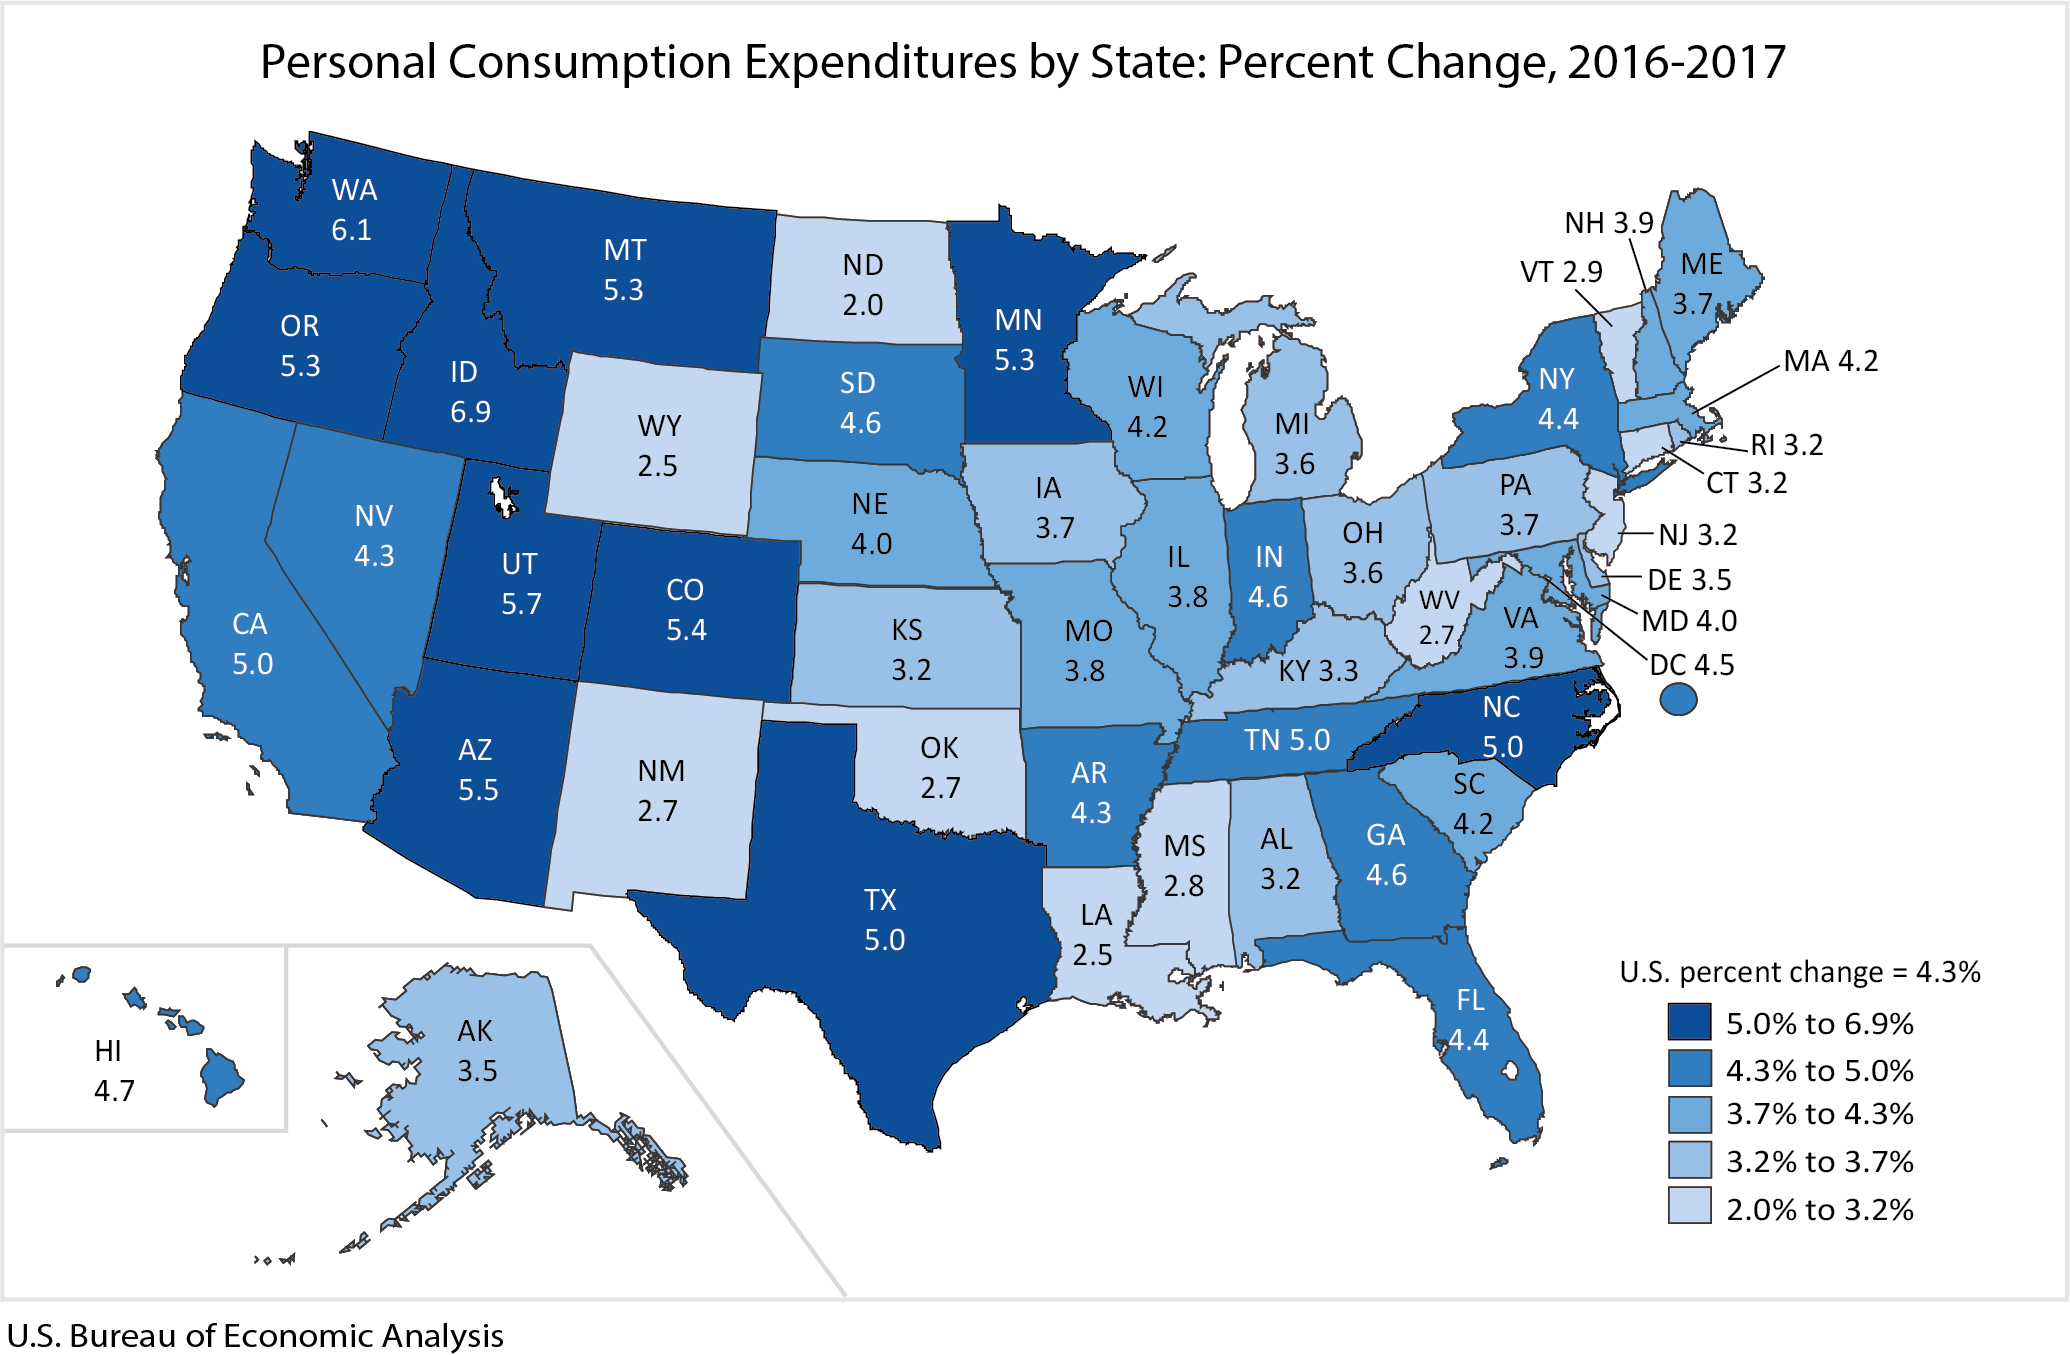
State personal consumption expenditures (PCE) increased on average 4.3 percent in 2017, an acceleration from the 3.8 percent increase in 2016 (table 1), according to statistics released today by the Bureau of Economic Analysis. The percent change in PCE across all states ranged from 6.9 percent in Idaho to 2.0 percent in North Dakota.
After Idaho, the states with the fastest growth in PCE were Washington, Utah, and Arizona. Idaho and Utah were also among the fastest growing states in 2016. After North Dakota, the states with the slowest PCE growth were Wyoming, Louisiana, and Oklahoma.
Category growth in PCE by state. In 2017, expenditure growth in health care and housing and utilities were the leading contributors to national PCE growth (table 3). These categories grew 4.6 percent and 4.0 percent, respectively (table 2). Spending on health care and on housing and utilities were also among the leading contributors to PCE growth in most states, including the four fastest growing states.
- Arizona, Idaho, and Washington experienced above average growth in health care expenditures at 7.0 percent, 6.6 percent, and 6.5 percent, respectively.
- Washington, Idaho, and Utah experienced above average growth in housing and utilities expenditures at 5.1 percent, 4.3 percent, and 4.1 percent, respectively.
Gasoline and other energy goods expenditures increased on average 11.7 percent in 2017. It was the first year-over-year increase since 2012. Spending on gasoline and other energy goods increased in every state. Washington and Idaho experienced larger than average increases in this expenditure category – 16.0 percent and 14.9 percent, respectively.
Per capita PCE by state in 2017. Across all states and the District of Columbia, per capita PCE was $40,878 (table 4). Per capita PCE by state ranged from a high of $53,267 in Massachusetts to a low of $30,027 in Mississippi. Per capita PCE in the District of Columbia was $60,914.
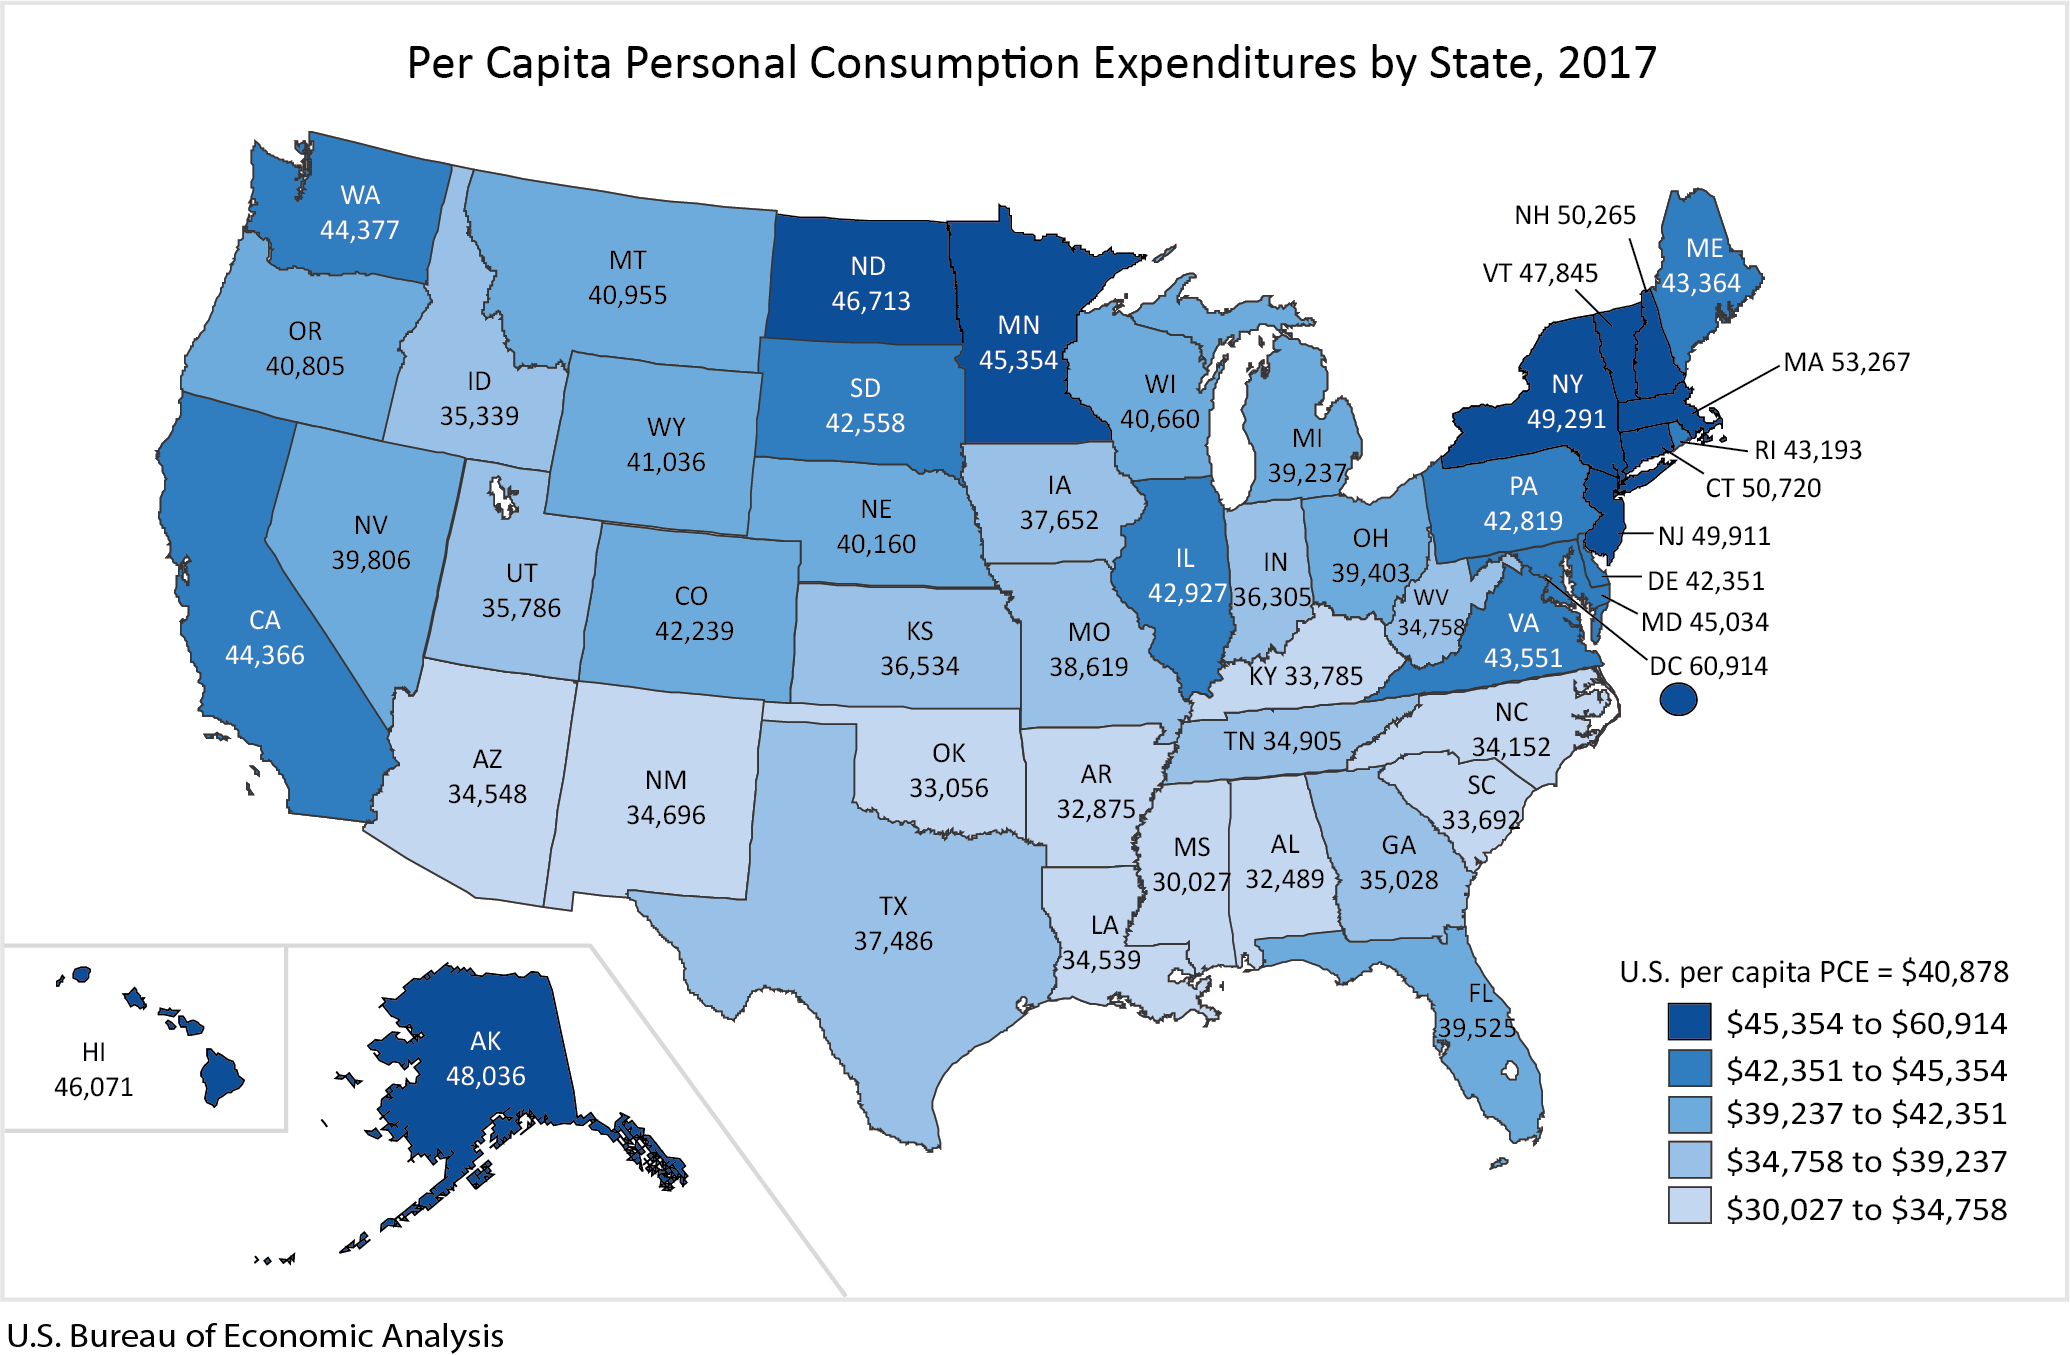
- After Massachusetts, the states with the highest per capita PCE were Connecticut, New Hampshire, and New Jersey. After Mississippi, the states with the lowest per capita PCE were Alabama, Arkansas, and Oklahoma.
- Massachusetts, Connecticut, and New Hampshire had above average per capita spending on housing and utilities, health care, and food and beverages purchased for off-premises consumption. New Hampshire also had above average per capita spending on gasoline and other energy goods.
- Mississippi, Arkansas, Alabama, and Oklahoma were among the states with the lowest per capita spending on housing and utilities and food and beverages purchased for off-premises consumption. These states also had below average per capita spending on health care, but above average per capita spending on gasoline and other energy goods.
More information on per capita spending for these categories can be found in the supplemental maps that accompany this release.
Comprehensive Update of Personal Consumption Expenditures by State
Today, BEA also released revised estimates of personal consumption expenditures by state for 1997 to 2016. Updates were made to incorporate the results of the July 2018 comprehensive update of the National Income and Product Accounts and the September 2018 comprehensive update of state personal income statistics.
The update also incorporates more complete and more detailed regional source data than previously available, and improvements to the statistical methods used to generate these estimates. Additional information on the methodological changes introduced with this comprehensive update is presented in an article in the August 2018 issue of the Survey of Current Business.
Next release: October 3, 2019
Personal Consumption Expenditures by State, 2018