
News Release
Arts and Cultural Production Satellite Account, U.S. and States 2016
Arts and Culture Continues to Grow in 2016 | Nevada leads states with 14.7 percent growth
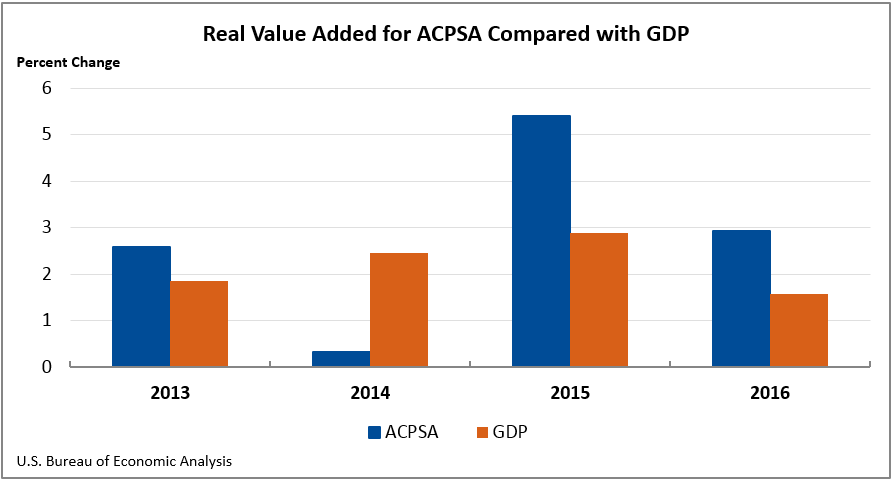
The Arts and Cultural Production Satellite Account (ACPSA) released today by the U.S. Department of Commerce's Bureau of Economic Analysis (BEA) shows that arts and cultural economic activity, adjusted for inflation, increased 2.9 percent in 2016. That compares with a 5.4 percent increase in 2015 (table 1). Arts and cultural economic activity accounted for 4.3 percent of gross domestic product (GDP), or $804.2 billion, in 2016.
Information services was the leading contributor to the national growth in 2016, followed by retail services. Core arts and cultural production industries, which includes performing arts, museums, design services, and fine arts education, grew 1.8 percent. Supporting arts and cultural production industries, including art support services and information services, increased 3.4 percent.
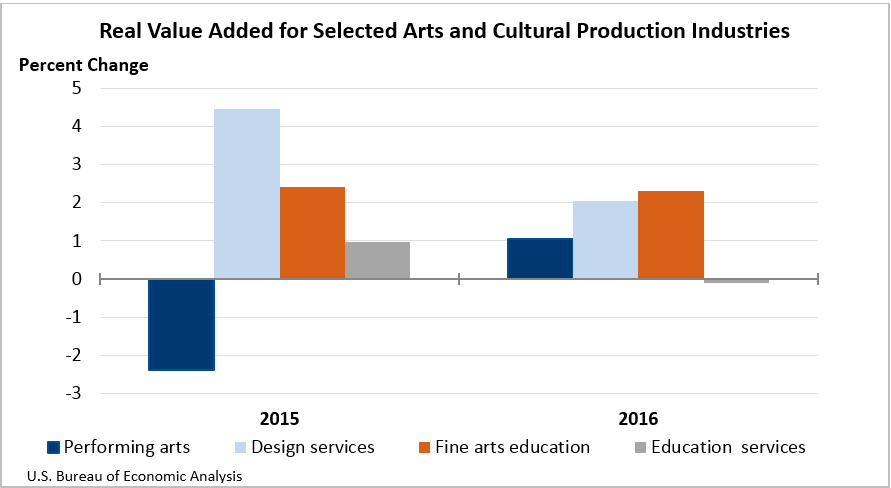
- For the performing arts group, real value added increased 1.1 percent in 2016, after decreasing 2.4 percent in 2015. The increase was primarily attributed to an increase in performing arts companies. The performing arts group includes performing arts companies, promoters of performing arts, agents and managers for artists, and independent artists, writers and performers.
- For design services, which includes advertising, architectural services, and graphic design services, real value added increased 2.0 percent in 2016, after increasing 4.5 percent in 2015. The leading contributor to the increase was advertising.
- Fine arts education grew 2.3 percent in 2016, after increasing 2.4 percent in 2015.
- Education services decreased 0.1 percent in 2016, after increasing 1.0 percent in 2015.
Nominal Value Added. Nominal value added (not adjusted for inflation) increased 4.6 percent nationally in 2016 (table 2). It increased 4.7 percent in the core arts and cultural production industries, to a level of $154.3 billion. The increase was primarily attributed to an increase in performing arts, which includes performing arts companies, promoters, agents/managers, independent arts, writers and performers.
Nominal value added increased 4.7 percent in the supporting arts and cultural production industries, to a level of $622.4 billion. The increase was primarily attributed to an increase in information services, which includes the broadcasting and motion pictures industries.
For states and the District of Columbia, the arts and cultural share of GDP ranged from 8.5 percent in D.C. to 1.5 percent in Delaware (table 3). The share for most states was between 2 and 5 percent. The District of Columbia, Washington, New York, and California were the only areas where the arts and culture share of total value added exceeded 5 percent.
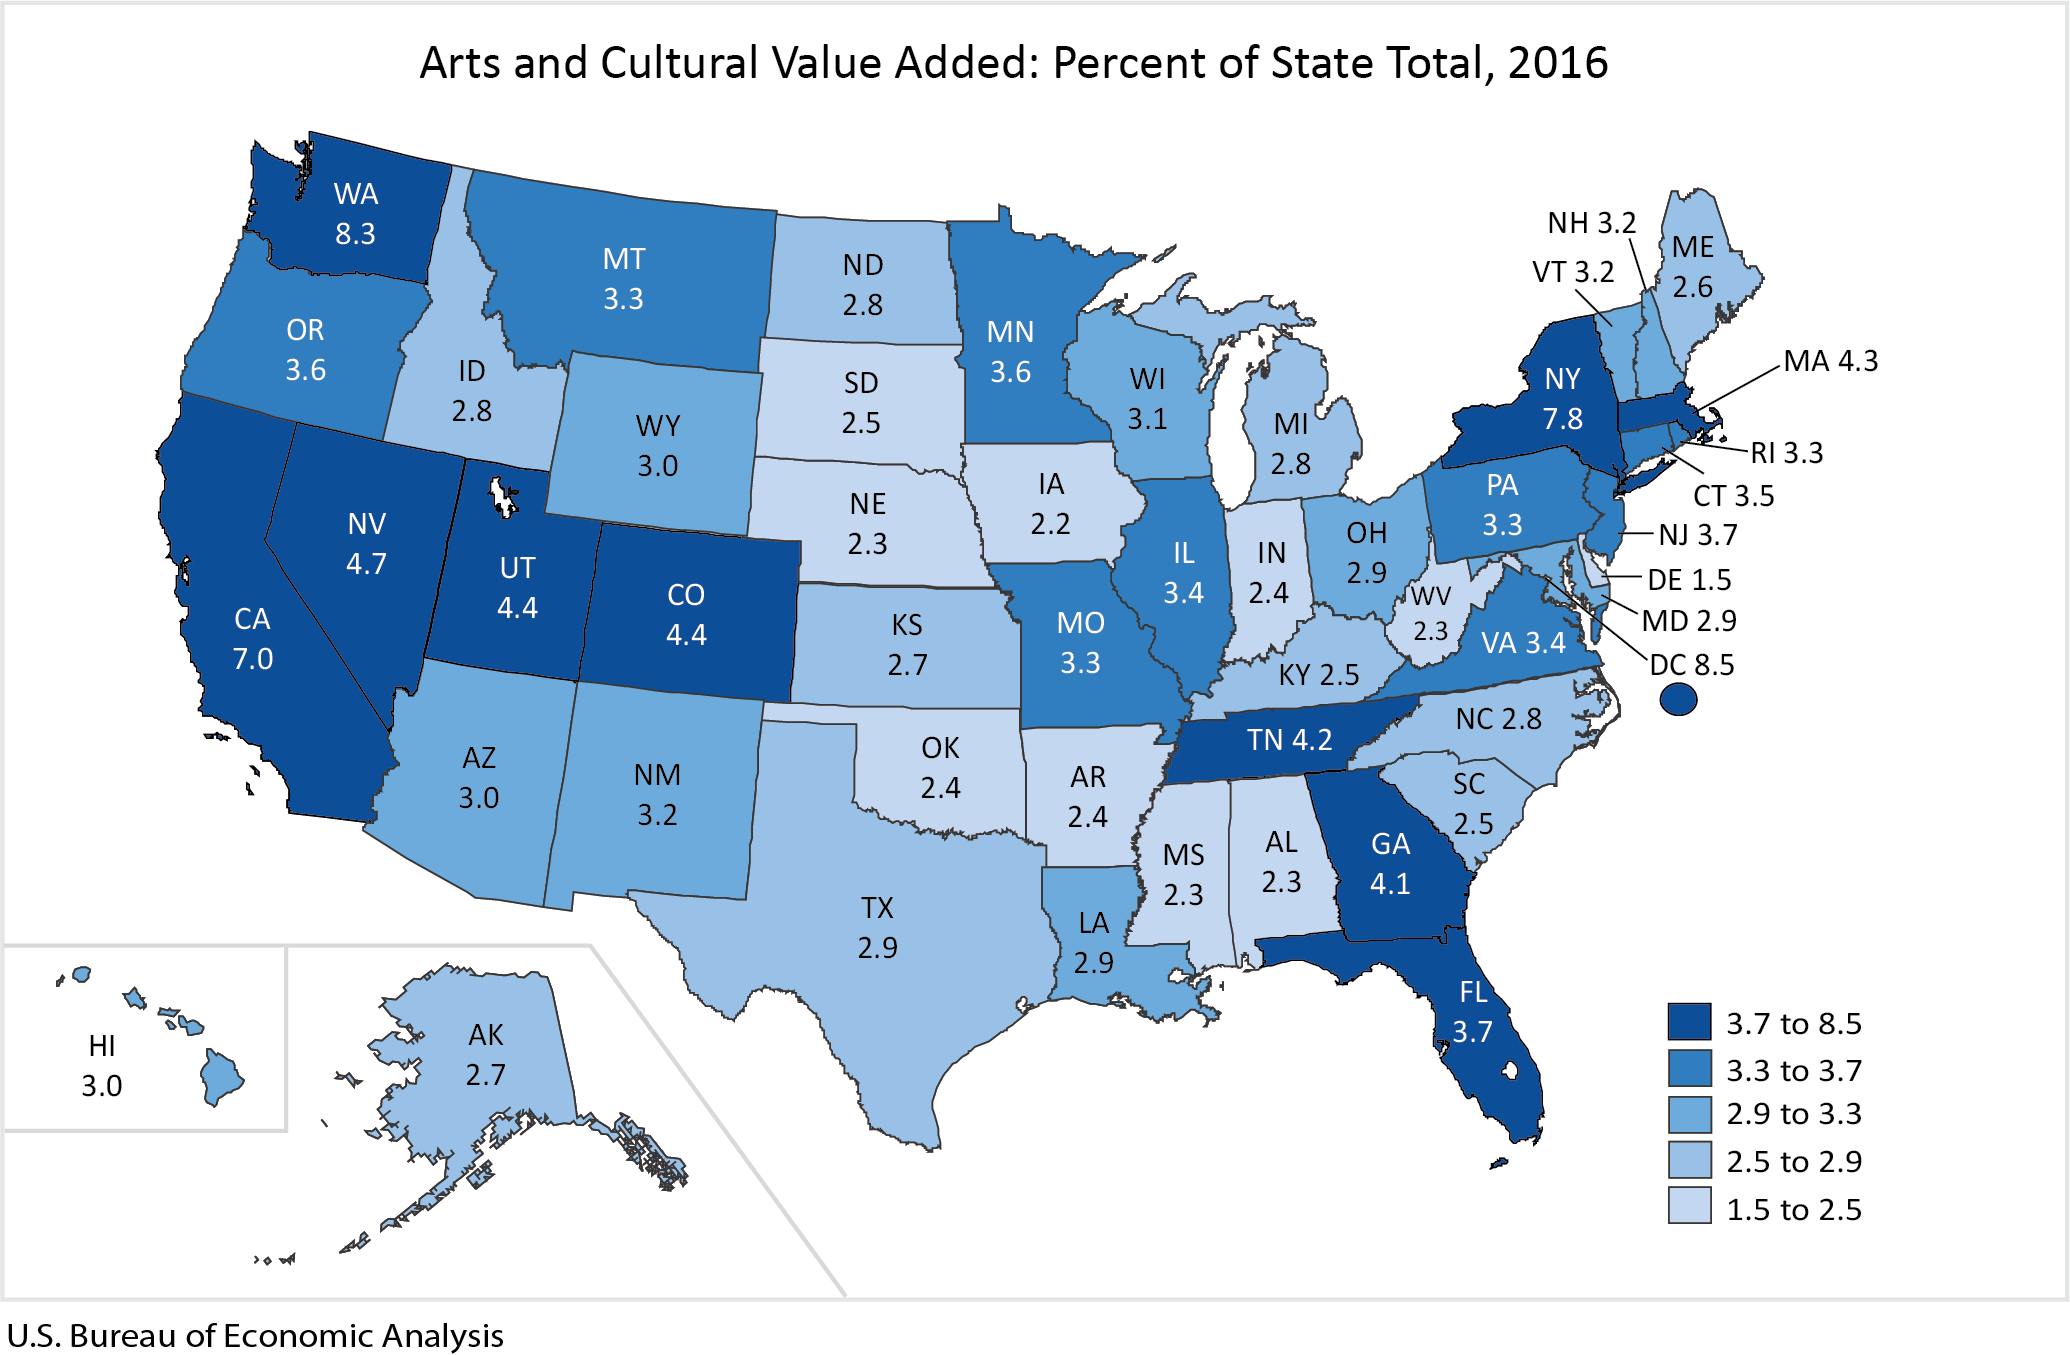
The top arts and cultural industries varied among the states. The top industries in the District of Columbia were government, broadcasting, and advertising (table 3). In New York, the top industries were motion pictures, broadcasting, and government. In California, the top industries were motion pictures, other information services, and broadcasting.
Value added in arts and cultural industries increased in every state and the District of Columbia in 2016, except Louisiana. The percent change in value added in arts and cultural industries across all states ranged from 14.7 percent in Nevada to -13.1 percent in Louisiana in 2016 (table 4). The promoters of performing arts and motion pictures industries led growth in Nevada.
Employment. Arts and cultural employment nationwide increased 2.5 percent in 2016 (table 8). The total number of arts and cultural jobs for the nation was 5.0 million. Arts and cultural employment increased in 39 states and the District of Columbia. The percent change in arts and cultural employment across all states ranged from 9.6 percent in Washington to -4.7 percent in Louisiana.
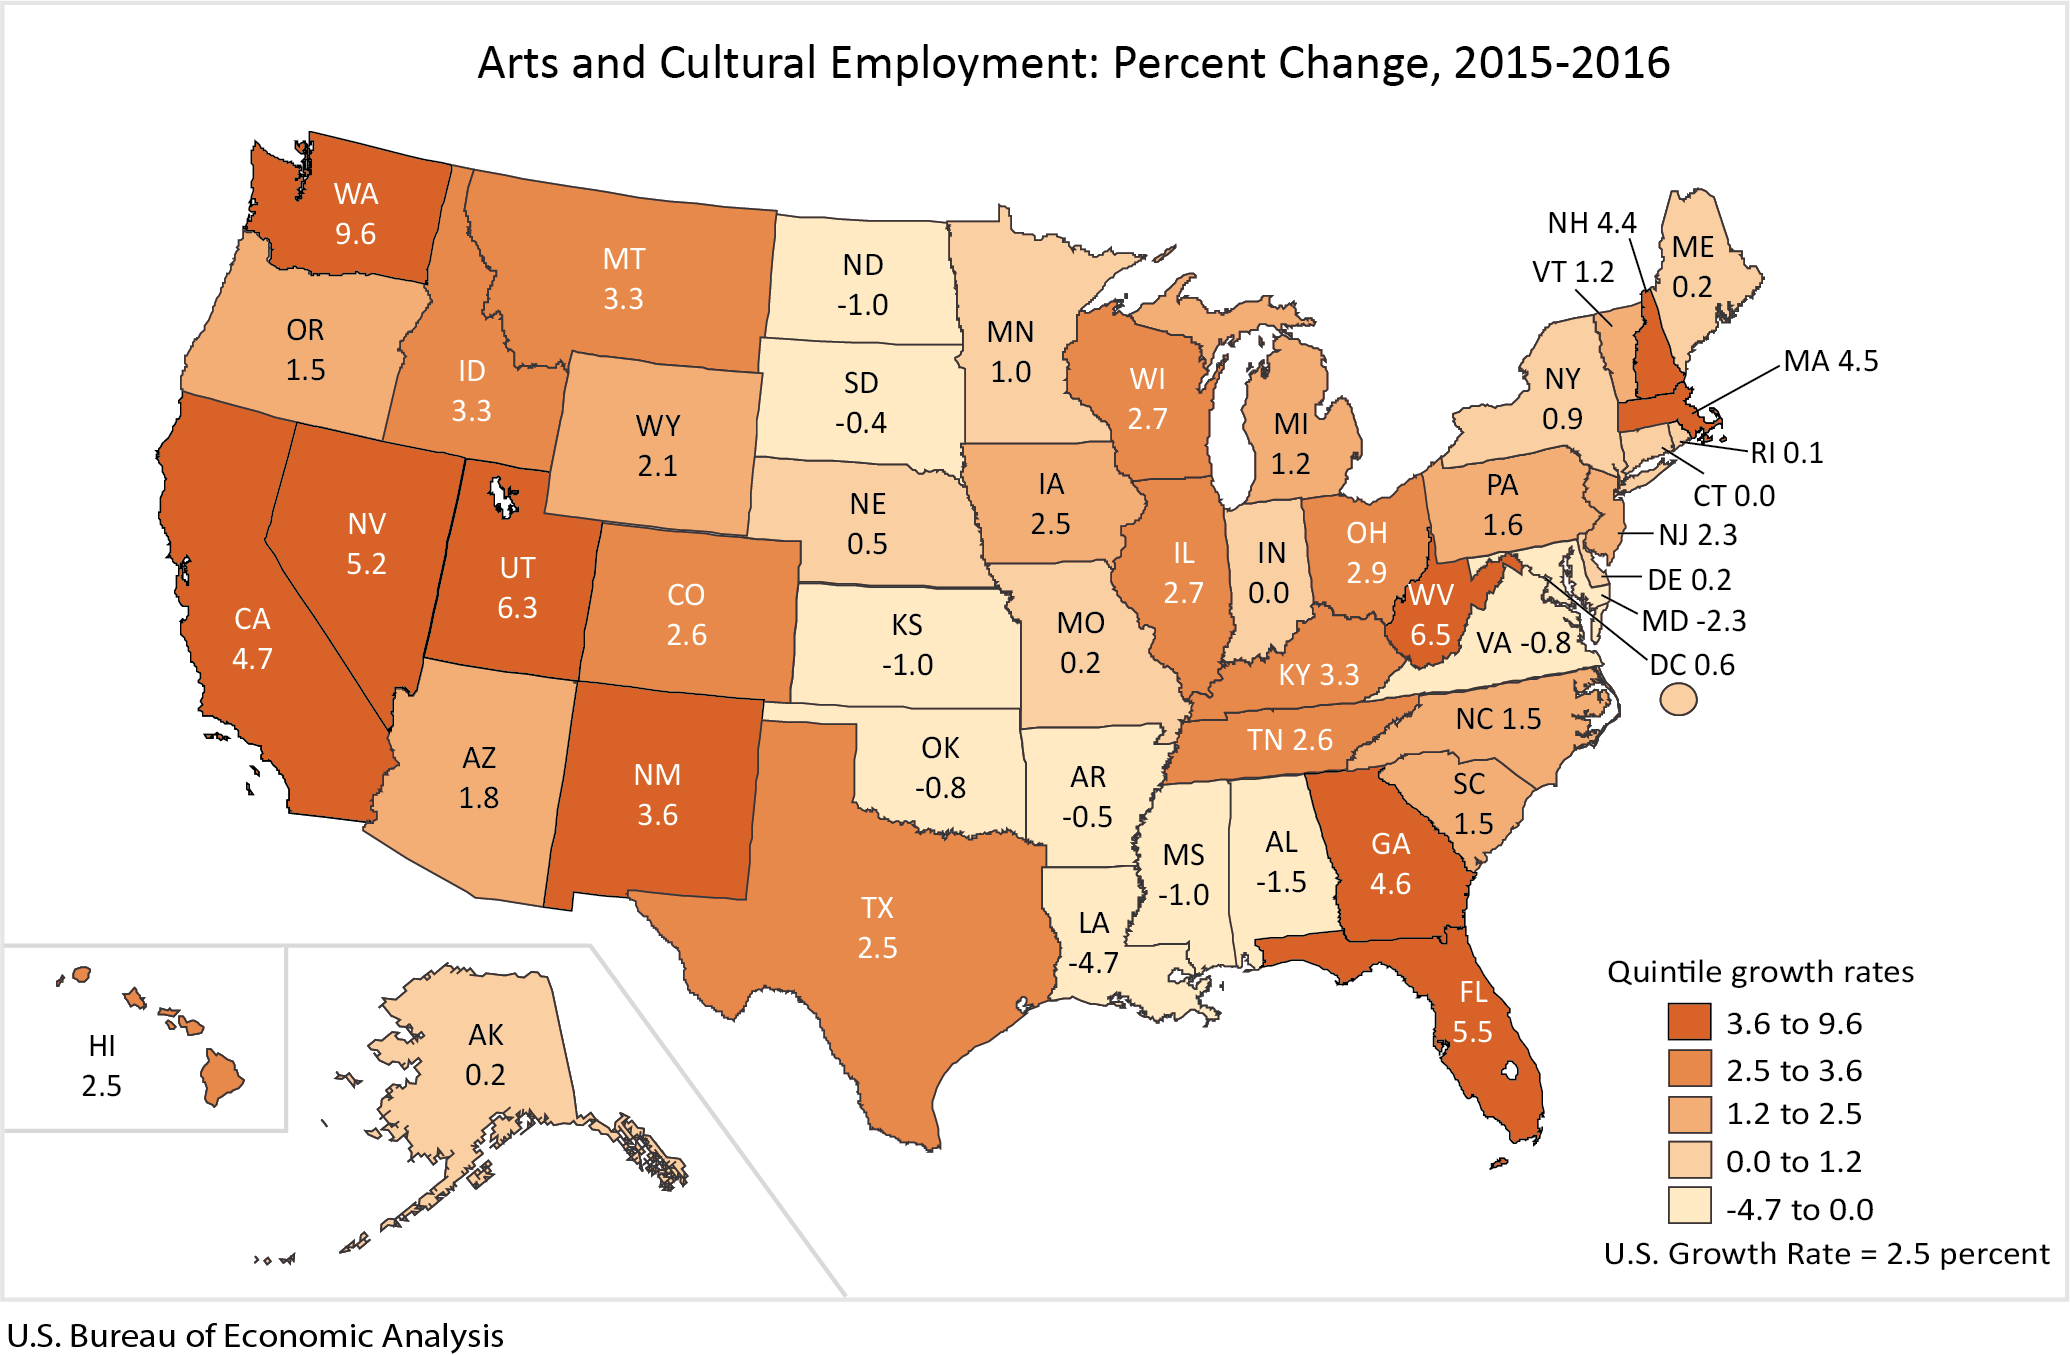
Arts and cultural employment increased faster in Washington than in any other state in 2016. Washington had 177,527 jobs related to arts and culture, representing 4.4 percent of all jobs in the state. The retail industry was the leading contributor to the increase in total arts and cultural employment in Washington (table 9).
Updates to the Arts and Cultural Production Satellite Account. Today, BEA also released updated estimates of output, value added, intermediate inputs, employment, and compensation for 2014 and 2015.
Note. BEA's Arts and Cultural Production Satellite Account (ACPSA) is supported by funding from the National Endowment for the Arts (NEA).