News Release
Personal Consumption Expenditures by State, 2018
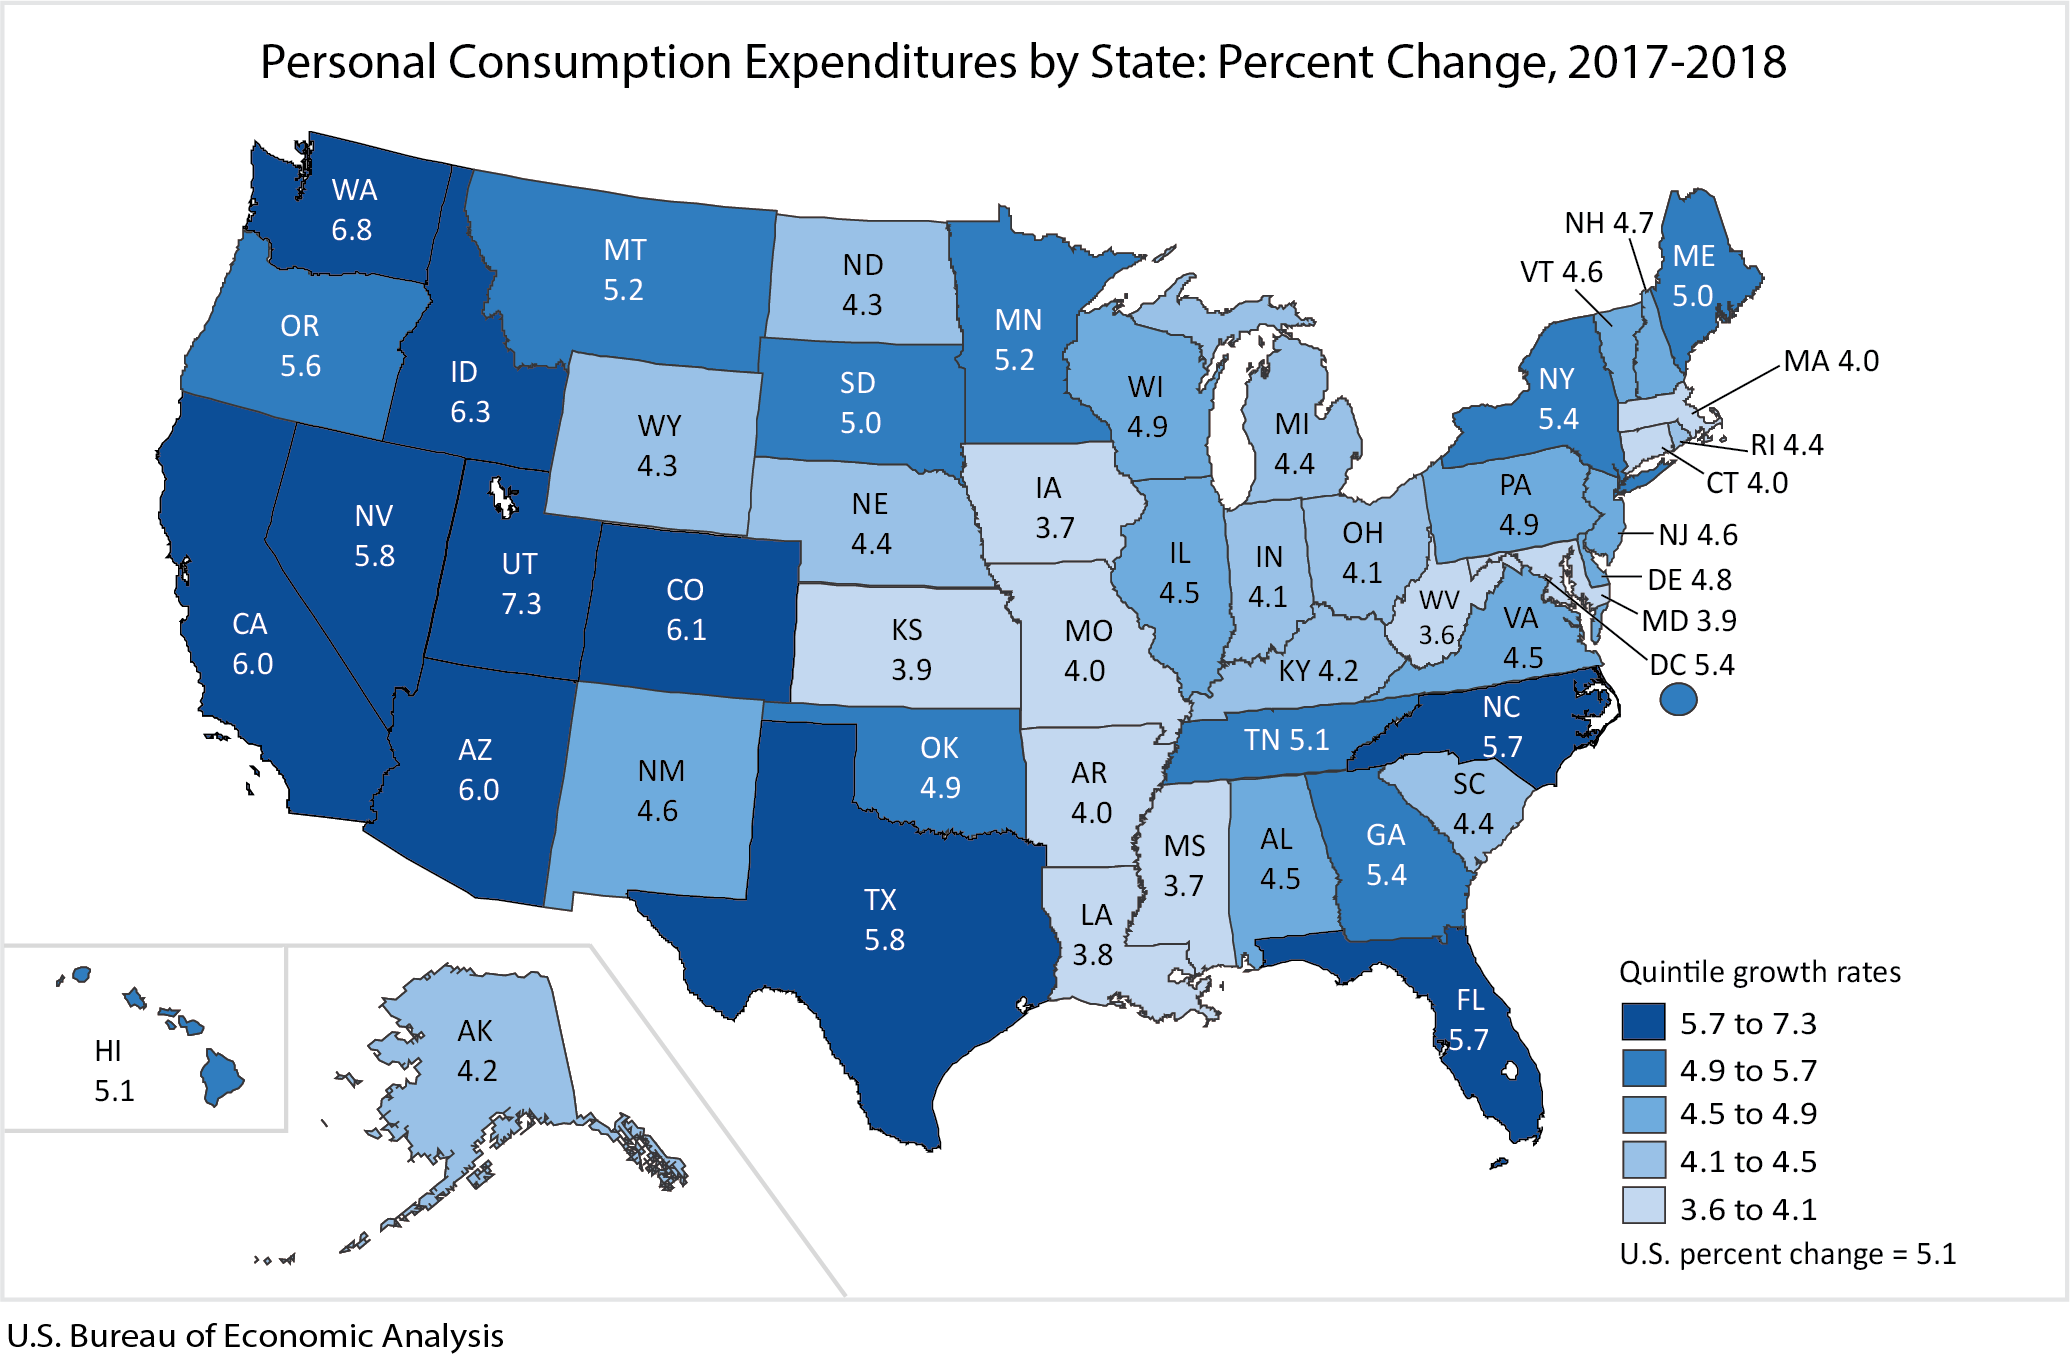
State personal consumption expenditures (PCE) increased 5.1 percent in 2018, an acceleration from the 4.4 percent increase in 2017 (table 1), according to statistics released today by the Bureau of Economic Analysis. The percent change in PCE across all states ranged from 7.3 percent in Utah to 3.6 percent in West Virginia.

PCE by state highlights
Expenditures on health care, and on housing and utilities increased 4.9 and 4.6 percent, respectively (table 2), and were the leading contributors to growth nationally (table 3).
- Expenditures on housing and utilities, other nondurable goods, and health care increased 5.2, 10.6, and 5.0 percent, respectively in Utah, the fastest growing state, and were the leading contributors to growth.
- Expenditures on health care, and housing and utilities were the leading contributors to the increase in PCE in Idaho, Washington, California, and Arizona.
- In West Virginia and Iowa, PCE expenditure growth was below the U.S. in every expenditure category.

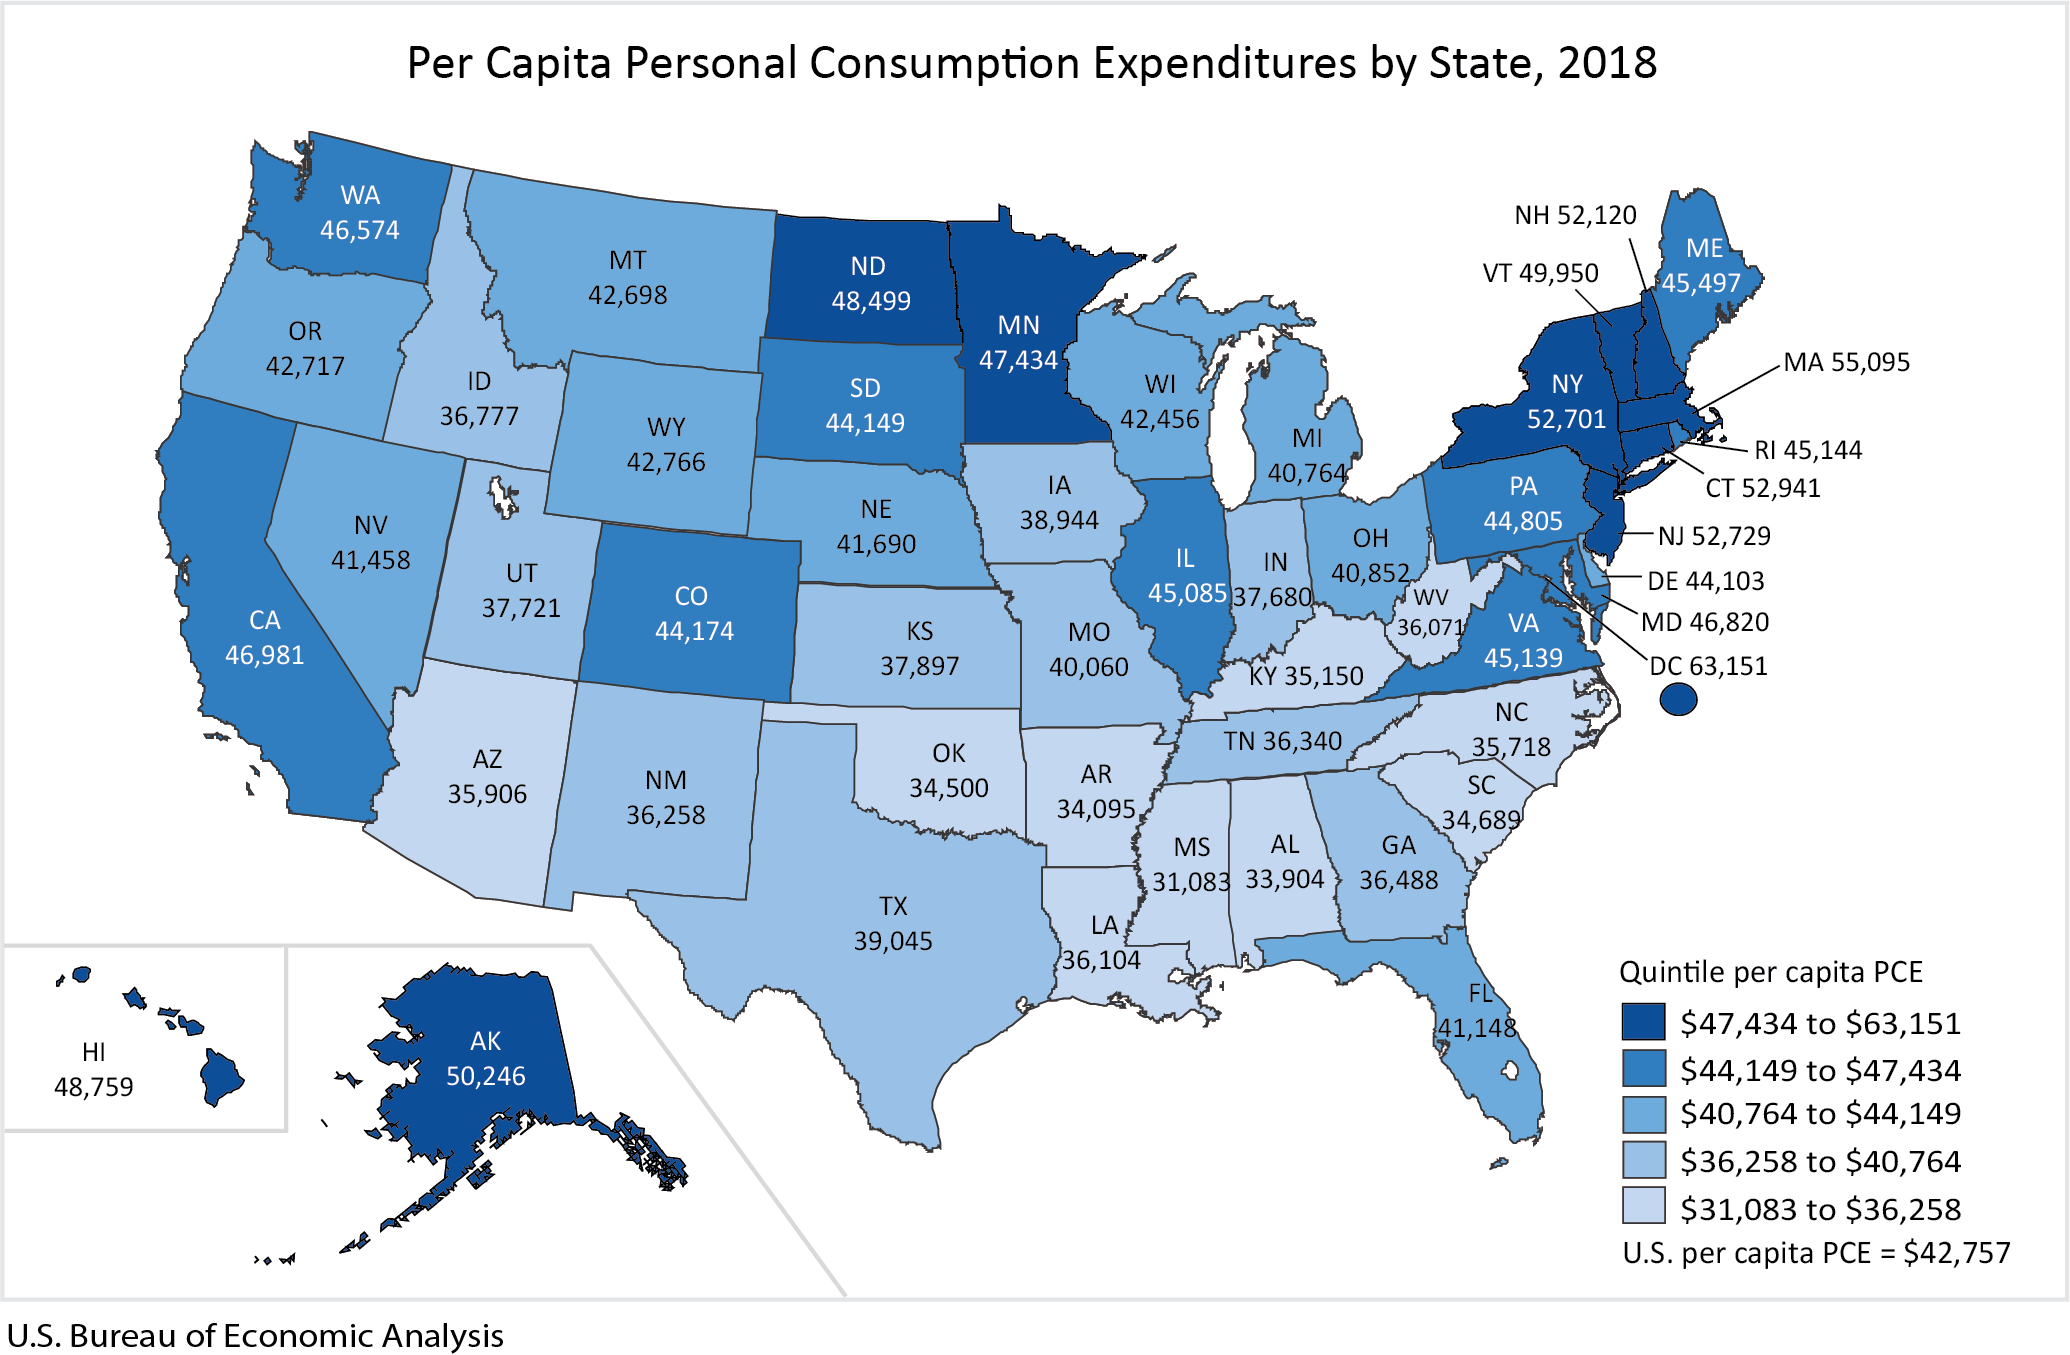
Across all states and the District of Columbia, per capita PCE was $42,757 (table 4). Per capita PCE by state ranged from a high of $55,095 in Massachusetts to a low of $31,083 in Mississippi. Per capita PCE in the District of Columbia was $63,151.
- Massachusetts, Connecticut, and New Jersey had above average per capita spending on housing and utilities, and health care.
- Mississippi, Alabama, Arkansas, and Oklahoma were among the states with the lowest per capita spending on housing and utilities, and health care.
Updates to Personal Consumption Expenditures by State
Today, BEA also released revised estimates for 2014 to 2017 (table 5). The update incorporates revised source data that are more complete than previously available. The update also includes the results of the July 2019 annual update of the National Income and Product Accounts and the results of the September 2019 annual update of the state personal income statistics.
Next release: October 8, 2020
Personal Consumption Expenditures by State, 2019